BajajHindusthan BAJAJHIND full analysis,charts,indicators,moving averages,SMA,DMA,EMA,ADX,MACD,RSIBajaj Hindusthan BAJAJHIND WideScreen charts, DMA,SMA,EMA technical analysis, forecast prediction, by indicators ADX,MACD,RSI,CCI NSE stock exchange
operates under Sugar sector
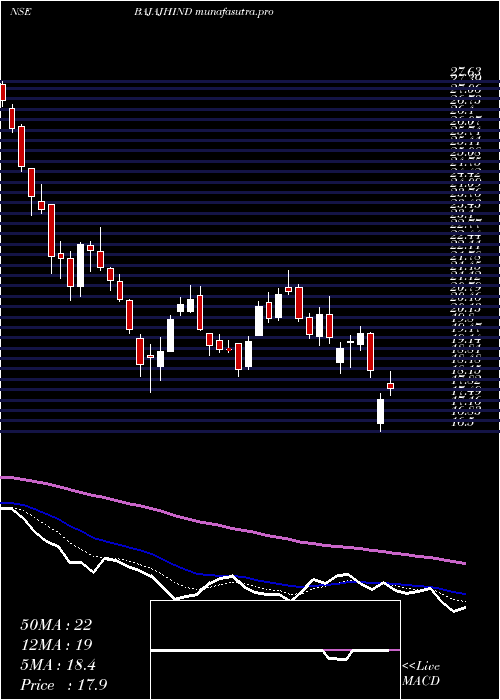
Daily price and charts and targets BajajHindusthan Strong Daily Stock price targets for BajajHindusthan BAJAJHIND are 19.43 and 20.56 | Daily Target 1 | 18.54 | | Daily Target 2 | 19.18 | | Daily Target 3 | 19.666666666667 | | Daily Target 4 | 20.31 | | Daily Target 5 | 20.8 |
Daily price and volume Bajaj Hindusthan
| Date |
Closing |
Open |
Range |
Volume |
Wed 10 December 2025 |
19.83 (4.37%) |
19.10 |
19.02 - 20.15 |
2.5747 times |
Tue 09 December 2025 |
19.00 (1.44%) |
18.70 |
18.19 - 19.10 |
1.2209 times |
Mon 08 December 2025 |
18.73 (-4.24%) |
19.61 |
18.51 - 19.68 |
1.3031 times |
Fri 05 December 2025 |
19.56 (-1.11%) |
19.74 |
19.50 - 19.77 |
0.5918 times |
Thu 04 December 2025 |
19.78 (0%) |
19.77 |
19.68 - 20.15 |
0.7573 times |
Wed 03 December 2025 |
19.78 (-1.2%) |
20.02 |
19.70 - 20.14 |
0.6907 times |
Tue 02 December 2025 |
20.02 (-0.79%) |
20.17 |
19.93 - 20.21 |
0.8704 times |
Mon 01 December 2025 |
20.18 (-1.75%) |
20.40 |
20.01 - 20.75 |
0.6904 times |
Fri 28 November 2025 |
20.54 (-2%) |
20.93 |
20.47 - 21.03 |
0.6066 times |
Thu 27 November 2025 |
20.96 (-0.05%) |
21.08 |
20.90 - 21.25 |
0.6942 times |
Wed 26 November 2025 |
20.97 (3.05%) |
20.38 |
20.35 - 21.20 |
0.9756 times |
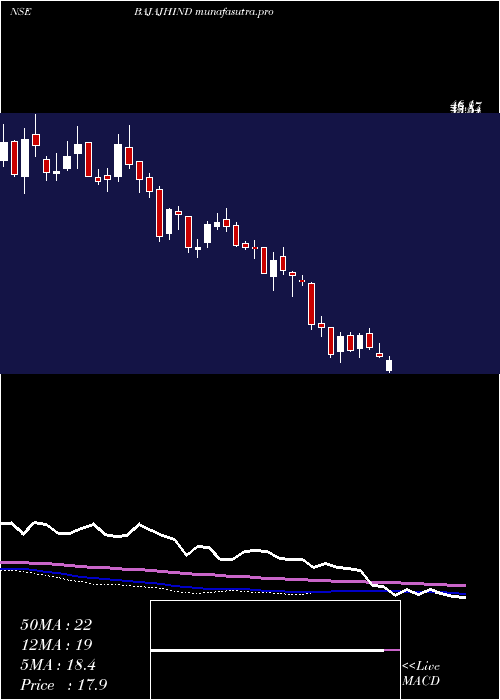
Weekly price and charts BajajHindusthan Strong weekly Stock price targets for BajajHindusthan BAJAJHIND are 19.01 and 20.97 | Weekly Target 1 | 17.43 | | Weekly Target 2 | 18.63 | | Weekly Target 3 | 19.39 | | Weekly Target 4 | 20.59 | | Weekly Target 5 | 21.35 |
Weekly price and volumes for Bajaj Hindusthan
| Date |
Closing |
Open |
Range |
Volume |
Wed 10 December 2025 |
19.83 (1.38%) |
19.61 |
18.19 - 20.15 |
0.9701 times |
Fri 05 December 2025 |
19.56 (-4.77%) |
20.40 |
19.50 - 20.75 |
0.6851 times |
Fri 28 November 2025 |
20.54 (-0.92%) |
20.80 |
20.25 - 21.25 |
0.6889 times |
Fri 21 November 2025 |
20.73 (-1.43%) |
21.03 |
20.67 - 21.34 |
0.6675 times |
Fri 14 November 2025 |
21.03 (-0.47%) |
21.87 |
20.88 - 22.13 |
0.8927 times |
Fri 07 November 2025 |
21.13 (-4.35%) |
22.00 |
20.82 - 22.82 |
0.8362 times |
Fri 31 October 2025 |
22.09 (-1.47%) |
22.49 |
21.86 - 23.10 |
1.1212 times |
Fri 24 October 2025 |
22.42 (6.46%) |
21.11 |
20.96 - 23.30 |
1.1636 times |
Fri 17 October 2025 |
21.06 (-5.35%) |
22.22 |
21.01 - 22.22 |
0.9826 times |
Fri 10 October 2025 |
22.25 (7.75%) |
20.69 |
20.20 - 22.82 |
1.9921 times |
Fri 03 October 2025 |
20.65 (3.15%) |
19.99 |
19.38 - 20.79 |
1.0483 times |
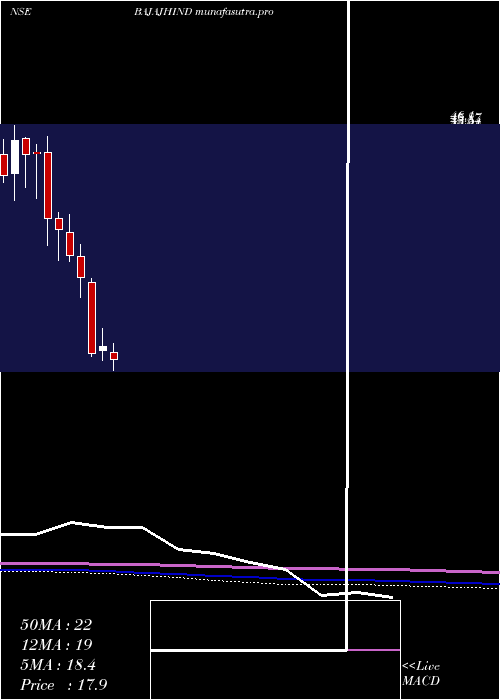
Monthly price and charts BajajHindusthan Strong monthly Stock price targets for BajajHindusthan BAJAJHIND are 17.73 and 20.29 | Monthly Target 1 | 17.03 | | Monthly Target 2 | 18.43 | | Monthly Target 3 | 19.59 | | Monthly Target 4 | 20.99 | | Monthly Target 5 | 22.15 |
Monthly price and volumes Bajaj Hindusthan
| Date |
Closing |
Open |
Range |
Volume |
Wed 10 December 2025 |
19.83 (-3.46%) |
20.40 |
18.19 - 20.75 |
0.2407 times |
Fri 28 November 2025 |
20.54 (-7.02%) |
22.00 |
20.25 - 22.82 |
0.4486 times |
Fri 31 October 2025 |
22.09 (11.62%) |
19.75 |
19.67 - 23.30 |
0.8267 times |
Tue 30 September 2025 |
19.79 (-2.13%) |
20.40 |
19.38 - 23.08 |
1.4637 times |
Fri 29 August 2025 |
20.22 (-13.37%) |
23.20 |
20.09 - 23.65 |
0.5373 times |
Thu 31 July 2025 |
23.34 (-9.92%) |
26.40 |
23.15 - 29.64 |
1.3844 times |
Mon 30 June 2025 |
25.91 (7.24%) |
24.14 |
22.50 - 26.81 |
1.315 times |
Fri 30 May 2025 |
24.16 (23.71%) |
19.40 |
18.01 - 25.70 |
1.3625 times |
Wed 30 April 2025 |
19.53 (0.31%) |
18.67 |
16.50 - 22.20 |
1.2294 times |
Fri 28 March 2025 |
19.47 (4.56%) |
18.90 |
17.72 - 21.62 |
1.1916 times |
Fri 28 February 2025 |
18.62 (-32.83%) |
27.13 |
18.25 - 27.67 |
0.9429 times |
DMA SMA EMA moving averages of Bajaj Hindusthan BAJAJHIND
DMA (daily moving average) of Bajaj Hindusthan BAJAJHIND
| DMA period | DMA value | | 5 day DMA | 19.38 | | 12 day DMA | 19.98 | | 20 day DMA | 20.34 | | 35 day DMA | 21.01 | | 50 day DMA | 21.04 | | 100 day DMA | 21.67 | | 150 day DMA | 22.61 | | 200 day DMA | 21.91 | EMA (exponential moving average) of Bajaj Hindusthan BAJAJHIND
| EMA period | EMA current | EMA prev | EMA prev2 | | 5 day EMA | 19.5 | 19.33 | 19.5 | | 12 day EMA | 19.87 | 19.88 | 20.04 | | 20 day EMA | 20.22 | 20.26 | 20.39 | | 35 day EMA | 20.55 | 20.59 | 20.68 | | 50 day EMA | 20.86 | 20.9 | 20.98 |
SMA (simple moving average) of Bajaj Hindusthan BAJAJHIND
| SMA period | SMA current | SMA prev | SMA prev2 | | 5 day SMA | 19.38 | 19.37 | 19.57 | | 12 day SMA | 19.98 | 20.03 | 20.17 | | 20 day SMA | 20.34 | 20.4 | 20.51 | | 35 day SMA | 21.01 | 21.06 | 21.12 | | 50 day SMA | 21.04 | 21.04 | 21.07 | | 100 day SMA | 21.67 | 21.75 | 21.83 | | 150 day SMA | 22.61 | 22.61 | 22.61 | | 200 day SMA | 21.91 | 21.92 | 21.94 |
|
|
