AxisamcAxistecetf AXISTECETF full analysis,charts,indicators,moving averages,SMA,DMA,EMA,ADX,MACD,RSIAxisamc Axistecetf AXISTECETF WideScreen charts, DMA,SMA,EMA technical analysis, forecast prediction, by indicators ADX,MACD,RSI,CCI NSE stock exchange
Daily price and charts and targets AxisamcAxistecetf Strong Daily Stock price targets for AxisamcAxistecetf AXISTECETF are 392.28 and 395.43 | Daily Target 1 | 389.73 | | Daily Target 2 | 391.67 | | Daily Target 3 | 392.87666666667 | | Daily Target 4 | 394.82 | | Daily Target 5 | 396.03 |
Daily price and volume Axisamc Axistecetf
| Date |
Closing |
Open |
Range |
Volume |
Wed 29 October 2025 |
393.62 (0.72%) |
390.93 |
390.93 - 394.08 |
1.1198 times |
Tue 28 October 2025 |
390.79 (-0.4%) |
392.37 |
388.76 - 393.35 |
0.385 times |
Mon 27 October 2025 |
392.37 (-0.98%) |
400.25 |
390.00 - 405.60 |
0.533 times |
Fri 24 October 2025 |
396.25 (1.06%) |
391.10 |
388.81 - 401.00 |
4.737 times |
Thu 23 October 2025 |
392.10 (2.34%) |
388.02 |
387.68 - 395.05 |
0.864 times |
Tue 21 October 2025 |
383.14 (0.28%) |
382.08 |
380.10 - 385.49 |
0.1576 times |
Mon 20 October 2025 |
382.08 (0.96%) |
382.97 |
380.11 - 382.97 |
0.0609 times |
Fri 17 October 2025 |
378.45 (-1.41%) |
380.47 |
377.71 - 380.89 |
0.2037 times |
Thu 16 October 2025 |
383.85 (0.23%) |
386.97 |
382.33 - 386.97 |
0.0445 times |
Wed 15 October 2025 |
382.97 (-0.04%) |
383.02 |
380.43 - 384.70 |
1.8944 times |
Tue 14 October 2025 |
383.12 (0.4%) |
391.11 |
379.91 - 396.01 |
5.3331 times |
Weekly price and charts AxisamcAxistecetf Strong weekly Stock price targets for AxisamcAxistecetf AXISTECETF are 382.77 and 399.61 | Weekly Target 1 | 379.15 | | Weekly Target 2 | 386.39 | | Weekly Target 3 | 395.99333333333 | | Weekly Target 4 | 403.23 | | Weekly Target 5 | 412.83 |
Weekly price and volumes for Axisamc Axistecetf
| Date |
Closing |
Open |
Range |
Volume |
Wed 29 October 2025 |
393.62 (-0.66%) |
400.25 |
388.76 - 405.60 |
0.8193 times |
Fri 24 October 2025 |
396.25 (4.7%) |
382.97 |
380.10 - 401.00 |
2.3396 times |
Fri 17 October 2025 |
378.45 (-1.58%) |
382.78 |
377.71 - 396.01 |
3.1701 times |
Fri 10 October 2025 |
384.51 (4.44%) |
370.00 |
367.13 - 386.58 |
0.7765 times |
Fri 03 October 2025 |
368.15 (0.84%) |
369.96 |
362.50 - 376.58 |
0.362 times |
Fri 26 September 2025 |
365.07 (-7.88%) |
382.51 |
364.17 - 391.99 |
0.7231 times |
Fri 19 September 2025 |
396.31 (1.46%) |
388.41 |
382.05 - 403.74 |
0.4046 times |
Fri 12 September 2025 |
390.60 (4.09%) |
375.52 |
371.15 - 393.03 |
0.4727 times |
Fri 05 September 2025 |
375.25 (-1.5%) |
371.43 |
371.43 - 390.00 |
0.431 times |
Fri 29 August 2025 |
380.96 (-0.79%) |
389.41 |
379.41 - 394.13 |
0.5012 times |
Fri 22 August 2025 |
384.00 (1.72%) |
378.01 |
373.99 - 388.96 |
0.3641 times |
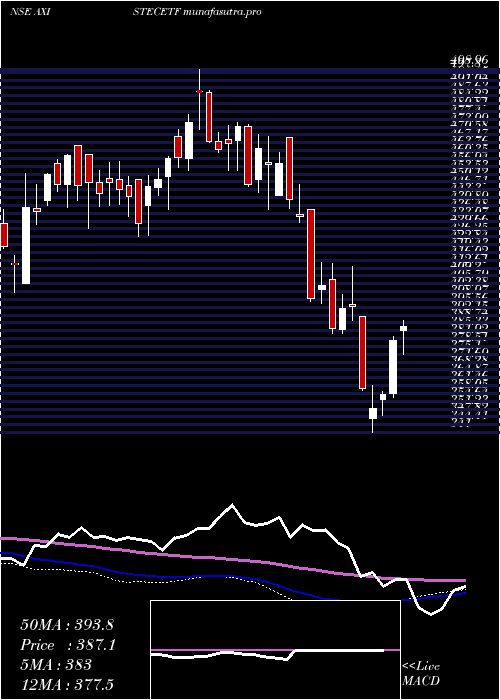
Monthly price and charts AxisamcAxistecetf Strong monthly Stock price targets for AxisamcAxistecetf AXISTECETF are 378.06 and 421.16 | Monthly Target 1 | 344.14 | | Monthly Target 2 | 368.88 | | Monthly Target 3 | 387.24 | | Monthly Target 4 | 411.98 | | Monthly Target 5 | 430.34 |
Monthly price and volumes Axisamc Axistecetf
| Date |
Closing |
Open |
Range |
Volume |
Wed 29 October 2025 |
393.62 (7.93%) |
364.47 |
362.50 - 405.60 |
0.7711 times |
Tue 30 September 2025 |
364.69 (-4.27%) |
371.43 |
363.95 - 403.74 |
0.2315 times |
Fri 29 August 2025 |
380.96 (-0.47%) |
382.77 |
370.70 - 394.13 |
0.1613 times |
Thu 31 July 2025 |
382.77 (-8.63%) |
421.39 |
379.31 - 425.50 |
2.155 times |
Mon 30 June 2025 |
418.93 (4.38%) |
401.35 |
395.28 - 426.44 |
0.6354 times |
Fri 30 May 2025 |
401.34 (4.52%) |
385.00 |
381.24 - 413.23 |
1.6048 times |
Wed 30 April 2025 |
383.98 (-3.05%) |
391.37 |
341.00 - 391.37 |
0.245 times |
Fri 28 March 2025 |
396.07 (-0.86%) |
403.50 |
384.00 - 414.98 |
0.2315 times |
Fri 28 February 2025 |
399.52 (-12.67%) |
444.01 |
398.00 - 469.44 |
1.329 times |
Fri 31 January 2025 |
457.50 (-0.84%) |
461.41 |
438.05 - 475.80 |
2.6353 times |
Tue 31 December 2024 |
461.36 (0.14%) |
460.50 |
454.90 - 498.96 |
0.158 times |
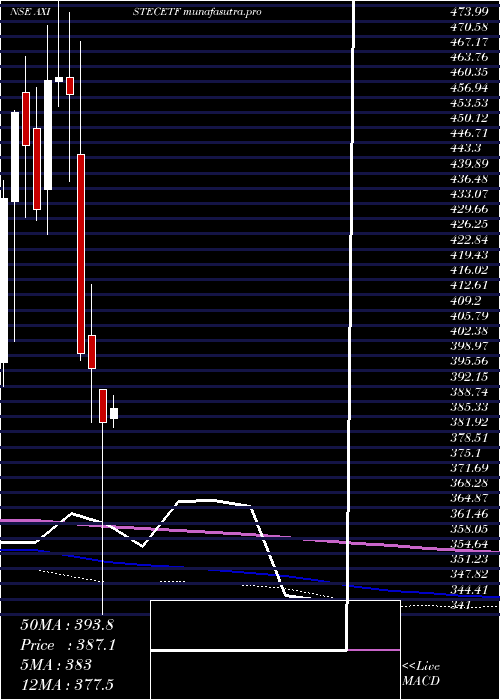
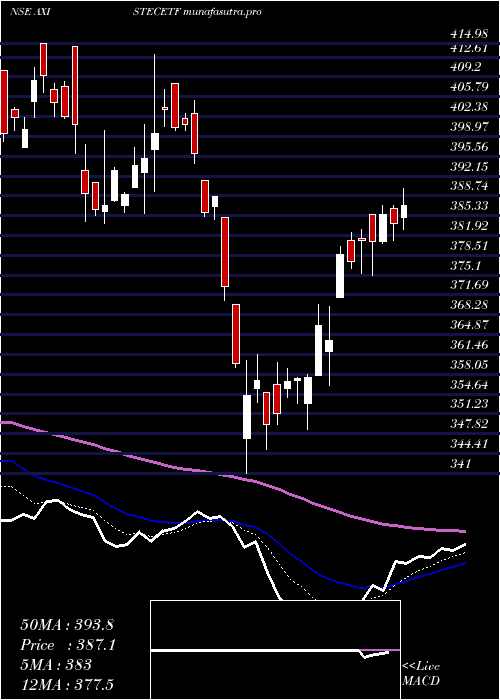
DMA SMA EMA moving averages of Axisamc Axistecetf AXISTECETF
DMA (daily moving average) of Axisamc Axistecetf AXISTECETF
| DMA period | DMA value | | 5 day DMA | 393.03 | | 12 day DMA | 386.69 | | 20 day DMA | 382.09 | | 35 day DMA | 383.14 | | 50 day DMA | 383.01 | | 100 day DMA | 392.85 | | 150 day DMA | 391.05 | | 200 day DMA | 402.31 | EMA (exponential moving average) of Axisamc Axistecetf AXISTECETF
| EMA period | EMA current | EMA prev | EMA prev2 | | 5 day EMA | 391.45 | 390.36 | 390.14 | | 12 day EMA | 387.71 | 386.64 | 385.89 | | 20 day EMA | 385.4 | 384.54 | 383.88 | | 35 day EMA | 383.82 | 383.24 | 382.8 | | 50 day EMA | 383.37 | 382.95 | 382.63 |
SMA (simple moving average) of Axisamc Axistecetf AXISTECETF
| SMA period | SMA current | SMA prev | SMA prev2 | | 5 day SMA | 393.03 | 390.93 | 389.19 | | 12 day SMA | 386.69 | 385.93 | 385.41 | | 20 day SMA | 382.09 | 380.64 | 379.36 | | 35 day SMA | 383.14 | 382.52 | 382.08 | | 50 day SMA | 383.01 | 382.69 | 382.39 | | 100 day SMA | 392.85 | 392.93 | 392.99 | | 150 day SMA | 391.05 | 391.05 | 391.04 | | 200 day SMA | 402.31 | 402.66 | 403.03 |
|
|
