AxisamcAxiscetf AXISCETF full analysis,charts,indicators,moving averages,SMA,DMA,EMA,ADX,MACD,RSIAxisamc Axiscetf AXISCETF WideScreen charts, DMA,SMA,EMA technical analysis, forecast prediction, by indicators ADX,MACD,RSI,CCI NSE stock exchange
Daily price and charts and targets AxisamcAxiscetf Strong Daily Stock price targets for AxisamcAxiscetf AXISCETF are 127.75 and 129.47 | Daily Target 1 | 127.35 | | Daily Target 2 | 128.15 | | Daily Target 3 | 129.07333333333 | | Daily Target 4 | 129.87 | | Daily Target 5 | 130.79 |
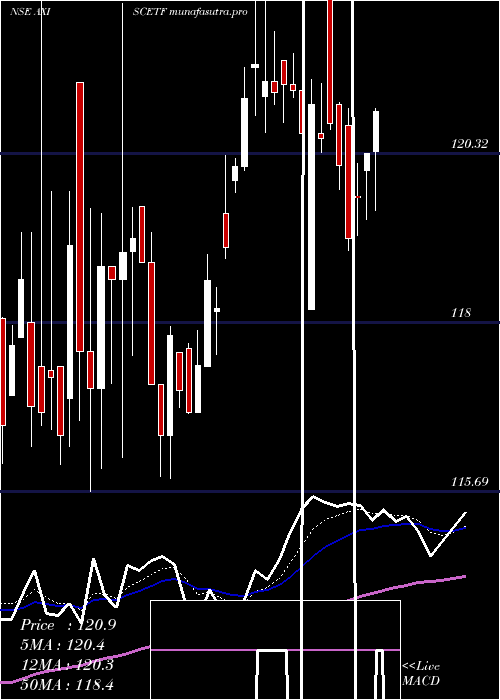
Daily price and volume Axisamc Axiscetf
| Date |
Closing |
Open |
Range |
Volume |
Tue 28 October 2025 |
128.94 (-0.17%) |
130.00 |
128.28 - 130.00 |
0.8362 times |
Mon 27 October 2025 |
129.16 (0.55%) |
128.45 |
128.45 - 129.74 |
0.8605 times |
Fri 24 October 2025 |
128.45 (-0.42%) |
128.84 |
128.16 - 131.70 |
0.5046 times |
Thu 23 October 2025 |
128.99 (-0.66%) |
130.65 |
128.84 - 131.85 |
0.612 times |
Tue 21 October 2025 |
129.85 (0.29%) |
129.47 |
128.83 - 131.41 |
0.9457 times |
Mon 20 October 2025 |
129.47 (-0.35%) |
129.35 |
129.33 - 130.28 |
0.4791 times |
Fri 17 October 2025 |
129.92 (1.2%) |
128.27 |
128.27 - 129.99 |
1.7685 times |
Thu 16 October 2025 |
128.38 (1.36%) |
127.61 |
127.25 - 128.86 |
1.9839 times |
Wed 15 October 2025 |
126.66 (1.24%) |
125.11 |
122.61 - 128.86 |
1.7497 times |
Tue 14 October 2025 |
125.11 (-0.74%) |
126.36 |
125.11 - 126.36 |
0.2599 times |
Mon 13 October 2025 |
126.04 (-0.25%) |
124.46 |
123.83 - 126.41 |
0.2072 times |
Weekly price and charts AxisamcAxiscetf Strong weekly Stock price targets for AxisamcAxiscetf AXISCETF are 128.61 and 130.33 | Weekly Target 1 | 127.35 | | Weekly Target 2 | 128.15 | | Weekly Target 3 | 129.07333333333 | | Weekly Target 4 | 129.87 | | Weekly Target 5 | 130.79 |
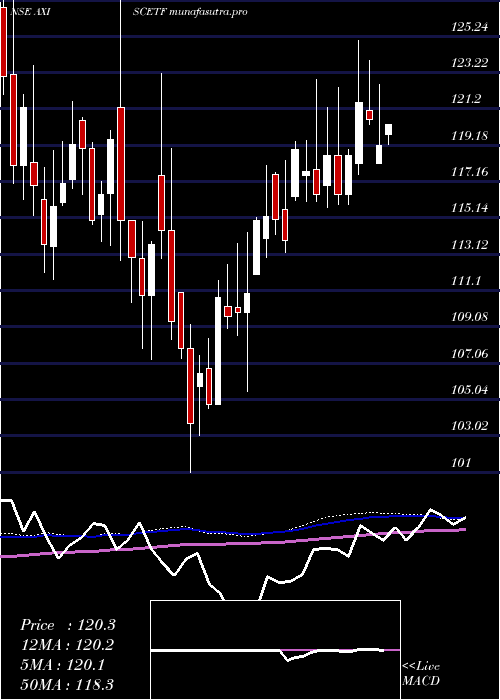
Weekly price and volumes for Axisamc Axiscetf
| Date |
Closing |
Open |
Range |
Volume |
Tue 28 October 2025 |
128.94 (0.38%) |
128.45 |
128.28 - 130.00 |
0.5445 times |
Fri 24 October 2025 |
128.45 (-1.13%) |
129.35 |
128.16 - 131.85 |
0.8155 times |
Fri 17 October 2025 |
129.92 (2.82%) |
124.46 |
122.61 - 129.99 |
1.9154 times |
Fri 10 October 2025 |
126.36 (1.56%) |
125.04 |
124.00 - 126.98 |
2.4678 times |
Fri 03 October 2025 |
124.42 (0.11%) |
124.30 |
121.00 - 126.04 |
0.4926 times |
Fri 26 September 2025 |
124.28 (-3%) |
127.59 |
123.00 - 130.13 |
0.8914 times |
Fri 19 September 2025 |
128.13 (1%) |
127.60 |
126.34 - 128.80 |
0.7493 times |
Fri 12 September 2025 |
126.86 (-0.35%) |
124.12 |
124.12 - 129.90 |
0.3433 times |
Fri 05 September 2025 |
127.31 (3.09%) |
124.48 |
124.40 - 130.00 |
1.2896 times |
Fri 29 August 2025 |
123.49 (-1.64%) |
124.93 |
123.47 - 126.36 |
0.4906 times |
Fri 22 August 2025 |
125.55 (3.05%) |
123.66 |
121.80 - 127.00 |
1.5618 times |
Monthly price and charts AxisamcAxiscetf Strong monthly Stock price targets for AxisamcAxiscetf AXISCETF are 125.78 and 135.02 | Monthly Target 1 | 118.56 | | Monthly Target 2 | 123.75 | | Monthly Target 3 | 127.8 | | Monthly Target 4 | 132.99 | | Monthly Target 5 | 137.04 |
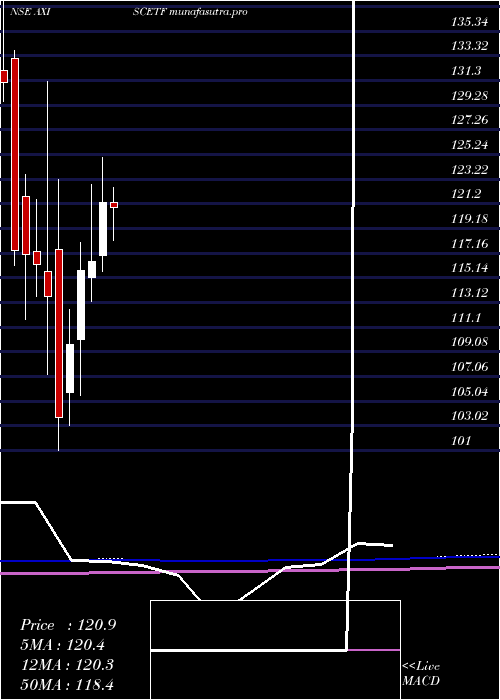
Monthly price and volumes Axisamc Axiscetf
| Date |
Closing |
Open |
Range |
Volume |
Tue 28 October 2025 |
128.94 (3.83%) |
124.80 |
122.61 - 131.85 |
1.1705 times |
Tue 30 September 2025 |
124.18 (0.56%) |
124.48 |
121.00 - 130.13 |
0.7404 times |
Fri 29 August 2025 |
123.49 (2.3%) |
120.71 |
119.38 - 127.00 |
0.5749 times |
Thu 31 July 2025 |
120.71 (-0.49%) |
121.31 |
117.30 - 123.71 |
0.5706 times |
Mon 30 June 2025 |
121.31 (4.17%) |
116.96 |
115.69 - 125.00 |
2.6125 times |
Fri 30 May 2025 |
116.45 (0.61%) |
115.17 |
113.24 - 122.82 |
1.5263 times |
Wed 30 April 2025 |
115.74 (5.54%) |
110.14 |
105.51 - 118.06 |
0.4308 times |
Fri 28 March 2025 |
109.66 (5.76%) |
105.76 |
103.03 - 112.57 |
0.4114 times |
Fri 28 February 2025 |
103.69 (-8.77%) |
117.50 |
101.00 - 123.17 |
0.5662 times |
Fri 31 January 2025 |
113.66 (-2.2%) |
115.66 |
107.25 - 131.26 |
1.3963 times |
Tue 31 December 2024 |
116.22 (-0.71%) |
117.30 |
113.61 - 121.58 |
0.5252 times |
DMA SMA EMA moving averages of Axisamc Axiscetf AXISCETF
DMA (daily moving average) of Axisamc Axiscetf AXISCETF
| DMA period | DMA value | | 5 day DMA | 129.08 | | 12 day DMA | 128.11 | | 20 day DMA | 126.81 | | 35 day DMA | 126.97 | | 50 day DMA | 126.46 | | 100 day DMA | 123.15 | | 150 day DMA | 120.26 | | 200 day DMA | 117.75 | EMA (exponential moving average) of Axisamc Axiscetf AXISCETF
| EMA period | EMA current | EMA prev | EMA prev2 | | 5 day EMA | 128.91 | 128.89 | 128.75 | | 12 day EMA | 128.22 | 128.09 | 127.89 | | 20 day EMA | 127.59 | 127.45 | 127.27 | | 35 day EMA | 126.77 | 126.64 | 126.49 | | 50 day EMA | 126.25 | 126.14 | 126.02 |
SMA (simple moving average) of Axisamc Axiscetf AXISCETF
| SMA period | SMA current | SMA prev | SMA prev2 | | 5 day SMA | 129.08 | 129.18 | 129.34 | | 12 day SMA | 128.11 | 127.89 | 127.54 | | 20 day SMA | 126.81 | 126.57 | 126.4 | | 35 day SMA | 126.97 | 126.92 | 126.86 | | 50 day SMA | 126.46 | 126.31 | 126.15 | | 100 day SMA | 123.15 | 123.03 | 122.92 | | 150 day SMA | 120.26 | 120.12 | 119.98 | | 200 day SMA | 117.75 | 117.69 | 117.64 |
|
|
