AxisamcAxisbpsetf AXISBPSETF full analysis,charts,indicators,moving averages,SMA,DMA,EMA,ADX,MACD,RSIAxisamc Axisbpsetf AXISBPSETF WideScreen charts, DMA,SMA,EMA technical analysis, forecast prediction, by indicators ADX,MACD,RSI,CCI NSE stock exchange
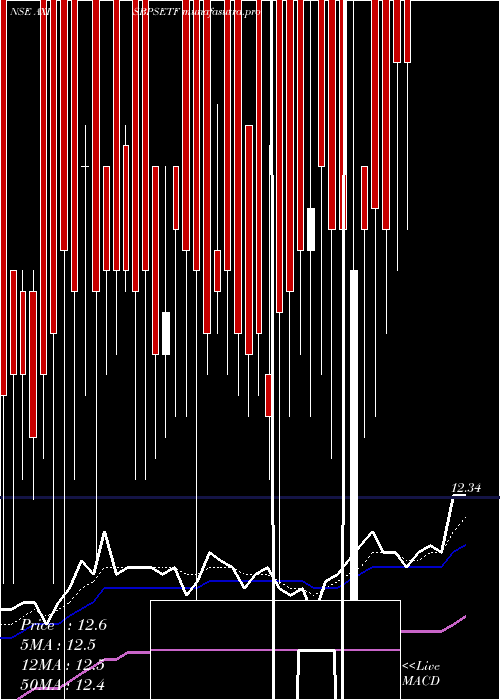
Daily price and charts and targets AxisamcAxisbpsetf Strong Daily Stock price targets for AxisamcAxisbpsetf AXISBPSETF are 12.7 and 13.21 | Daily Target 1 | 12.6 | | Daily Target 2 | 12.8 | | Daily Target 3 | 13.11 | | Daily Target 4 | 13.31 | | Daily Target 5 | 13.62 |
Daily price and volume Axisamc Axisbpsetf
| Date |
Closing |
Open |
Range |
Volume |
Wed 29 October 2025 |
13.00 (-0.23%) |
13.42 |
12.91 - 13.42 |
3.1413 times |
Tue 28 October 2025 |
13.03 (-0.84%) |
13.09 |
13.00 - 13.10 |
0.28 times |
Mon 27 October 2025 |
13.14 (1.15%) |
13.38 |
12.95 - 14.50 |
5.7579 times |
Fri 24 October 2025 |
12.99 (-0.15%) |
13.14 |
12.99 - 13.15 |
0.1825 times |
Thu 23 October 2025 |
13.01 (0%) |
13.40 |
12.95 - 13.40 |
0.1375 times |
Tue 21 October 2025 |
13.01 (0.39%) |
13.13 |
12.87 - 13.13 |
0.0413 times |
Mon 20 October 2025 |
12.96 (-0.08%) |
12.58 |
12.58 - 13.08 |
0.0917 times |
Fri 17 October 2025 |
12.97 (-0.23%) |
13.09 |
12.96 - 13.09 |
0.129 times |
Thu 16 October 2025 |
13.00 (0.31%) |
13.02 |
12.87 - 13.02 |
0.1172 times |
Wed 15 October 2025 |
12.96 (0.08%) |
12.56 |
12.56 - 13.08 |
0.1215 times |
Tue 14 October 2025 |
12.95 (-0.23%) |
13.04 |
12.92 - 13.05 |
0.2611 times |
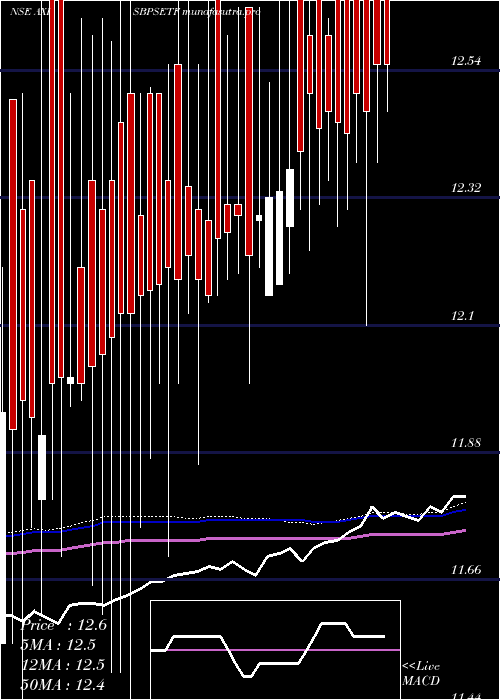
Weekly price and charts AxisamcAxisbpsetf Strong weekly Stock price targets for AxisamcAxisbpsetf AXISBPSETF are 12.16 and 13.75 | Weekly Target 1 | 11.88 | | Weekly Target 2 | 12.44 | | Weekly Target 3 | 13.47 | | Weekly Target 4 | 14.03 | | Weekly Target 5 | 15.06 |
Weekly price and volumes for Axisamc Axisbpsetf
| Date |
Closing |
Open |
Range |
Volume |
Wed 29 October 2025 |
13.00 (0.08%) |
13.38 |
12.91 - 14.50 |
1.3657 times |
Fri 24 October 2025 |
12.99 (0.15%) |
12.58 |
12.58 - 13.40 |
0.0674 times |
Fri 17 October 2025 |
12.97 (-0.08%) |
13.07 |
12.56 - 13.09 |
0.14 times |
Fri 10 October 2025 |
12.98 (0%) |
13.37 |
12.84 - 13.37 |
1.7178 times |
Fri 03 October 2025 |
12.98 (0.46%) |
13.31 |
12.75 - 13.40 |
0.2503 times |
Fri 26 September 2025 |
12.92 (-0.15%) |
13.26 |
12.81 - 13.29 |
1.6733 times |
Fri 19 September 2025 |
12.94 (0.15%) |
12.99 |
12.82 - 13.05 |
1.8026 times |
Fri 12 September 2025 |
12.92 (-0.31%) |
13.04 |
12.83 - 13.11 |
0.1549 times |
Fri 05 September 2025 |
12.96 (0.39%) |
12.98 |
12.80 - 13.29 |
1.6641 times |
Fri 29 August 2025 |
12.91 (0.47%) |
12.79 |
12.58 - 13.17 |
1.1638 times |
Fri 22 August 2025 |
12.85 (0.16%) |
12.95 |
12.78 - 12.95 |
2.0393 times |
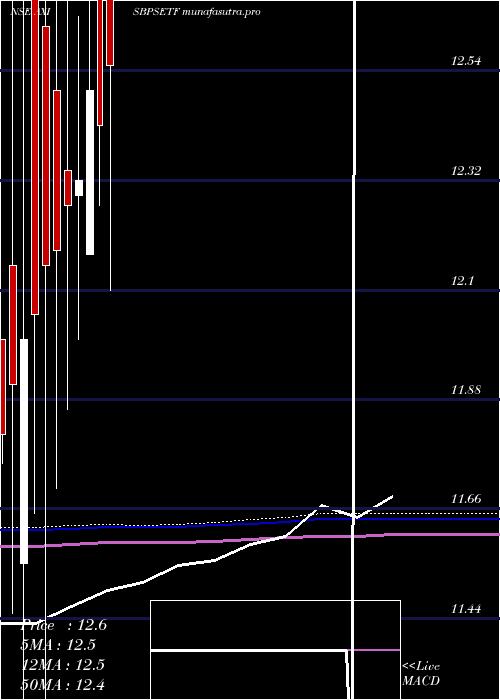
Monthly price and charts AxisamcAxisbpsetf Strong monthly Stock price targets for AxisamcAxisbpsetf AXISBPSETF are 12.78 and 14.72 | Monthly Target 1 | 11.41 | | Monthly Target 2 | 12.21 | | Monthly Target 3 | 13.353333333333 | | Monthly Target 4 | 14.15 | | Monthly Target 5 | 15.29 |
Monthly price and volumes Axisamc Axisbpsetf
| Date |
Closing |
Open |
Range |
Volume |
Wed 29 October 2025 |
13.00 (0.7%) |
12.75 |
12.56 - 14.50 |
0.5417 times |
Tue 30 September 2025 |
12.91 (0%) |
12.98 |
12.80 - 13.40 |
0.8503 times |
Fri 29 August 2025 |
12.91 (0.7%) |
12.84 |
12.58 - 13.17 |
1.0413 times |
Thu 31 July 2025 |
12.82 (0.71%) |
13.11 |
12.45 - 13.19 |
0.6222 times |
Mon 30 June 2025 |
12.73 (0.39%) |
12.82 |
12.37 - 13.13 |
0.2567 times |
Fri 30 May 2025 |
12.68 (0.71%) |
12.97 |
12.28 - 13.06 |
0.2994 times |
Wed 30 April 2025 |
12.59 (1.29%) |
12.75 |
12.10 - 12.96 |
1.9755 times |
Fri 28 March 2025 |
12.43 (-0.56%) |
12.90 |
12.27 - 12.90 |
0.1466 times |
Fri 28 February 2025 |
12.50 (1.46%) |
12.17 |
12.17 - 12.85 |
1.2055 times |
Fri 31 January 2025 |
12.32 (0.41%) |
12.29 |
12.00 - 12.65 |
3.0607 times |
Tue 31 December 2024 |
12.27 (0.74%) |
12.34 |
11.86 - 14.00 |
0.3855 times |
DMA SMA EMA moving averages of Axisamc Axisbpsetf AXISBPSETF
DMA (daily moving average) of Axisamc Axisbpsetf AXISBPSETF
| DMA period | DMA value | | 5 day DMA | 13.03 | | 12 day DMA | 13 | | 20 day DMA | 12.99 | | 35 day DMA | 12.96 | | 50 day DMA | 12.94 | | 100 day DMA | 12.85 | | 150 day DMA | 12.76 | | 200 day DMA | 12.66 | EMA (exponential moving average) of Axisamc Axisbpsetf AXISBPSETF
| EMA period | EMA current | EMA prev | EMA prev2 | | 5 day EMA | 13.03 | 13.04 | 13.04 | | 12 day EMA | 13 | 13 | 13 | | 20 day EMA | 12.98 | 12.98 | 12.98 | | 35 day EMA | 12.95 | 12.95 | 12.94 | | 50 day EMA | 12.93 | 12.93 | 12.93 |
SMA (simple moving average) of Axisamc Axisbpsetf AXISBPSETF
| SMA period | SMA current | SMA prev | SMA prev2 | | 5 day SMA | 13.03 | 13.04 | 13.02 | | 12 day SMA | 13 | 13 | 12.99 | | 20 day SMA | 12.99 | 12.99 | 12.98 | | 35 day SMA | 12.96 | 12.96 | 12.96 | | 50 day SMA | 12.94 | 12.93 | 12.93 | | 100 day SMA | 12.85 | 12.85 | 12.85 | | 150 day SMA | 12.76 | 12.75 | 12.75 | | 200 day SMA | 12.66 | 12.66 | 12.65 |
|
|
