AxisamcAxisbnketf AXISBNKETF full analysis,charts,indicators,moving averages,SMA,DMA,EMA,ADX,MACD,RSIAxisamc Axisbnketf AXISBNKETF WideScreen charts, DMA,SMA,EMA technical analysis, forecast prediction, by indicators ADX,MACD,RSI,CCI NSE stock exchange
Daily price and charts and targets AxisamcAxisbnketf Strong Daily Stock price targets for AxisamcAxisbnketf AXISBNKETF are 592.49 and 598.41 | Daily Target 1 | 590.83 | | Daily Target 2 | 594.15 | | Daily Target 3 | 596.74666666667 | | Daily Target 4 | 600.07 | | Daily Target 5 | 602.67 |
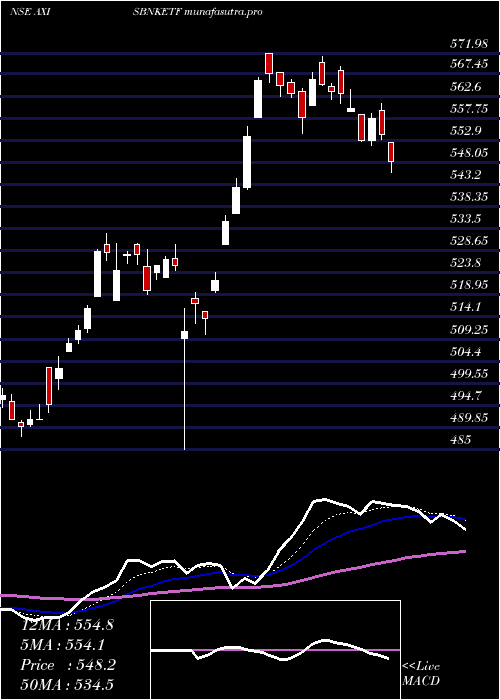
Daily price and volume Axisamc Axisbnketf
| Date |
Closing |
Open |
Range |
Volume |
Tue 28 October 2025 |
597.48 (-0%) |
597.50 |
593.42 - 599.34 |
0.3216 times |
Mon 27 October 2025 |
597.49 (0.72%) |
595.00 |
595.00 - 598.49 |
0.3913 times |
Fri 24 October 2025 |
593.20 (-0.51%) |
596.60 |
591.96 - 597.95 |
1.3188 times |
Thu 23 October 2025 |
596.26 (-0.14%) |
590.00 |
516.94 - 602.50 |
2.0546 times |
Tue 21 October 2025 |
597.08 (0.16%) |
596.16 |
595.80 - 598.70 |
0.0793 times |
Mon 20 October 2025 |
596.12 (0.6%) |
595.55 |
594.76 - 598.81 |
1.7305 times |
Fri 17 October 2025 |
592.56 (0.43%) |
589.25 |
589.25 - 595.38 |
2.7179 times |
Thu 16 October 2025 |
590.03 (1.2%) |
585.60 |
584.75 - 590.41 |
0.7416 times |
Wed 15 October 2025 |
583.06 (0.4%) |
581.99 |
581.99 - 584.91 |
0.5829 times |
Tue 14 October 2025 |
580.71 (-0.19%) |
572.50 |
572.50 - 583.93 |
0.0615 times |
Mon 13 October 2025 |
581.84 (-0.06%) |
585.11 |
579.00 - 585.11 |
0.6361 times |
Weekly price and charts AxisamcAxisbnketf Strong weekly Stock price targets for AxisamcAxisbnketf AXISBNKETF are 595.45 and 601.37 | Weekly Target 1 | 590.83 | | Weekly Target 2 | 594.15 | | Weekly Target 3 | 596.74666666667 | | Weekly Target 4 | 600.07 | | Weekly Target 5 | 602.67 |
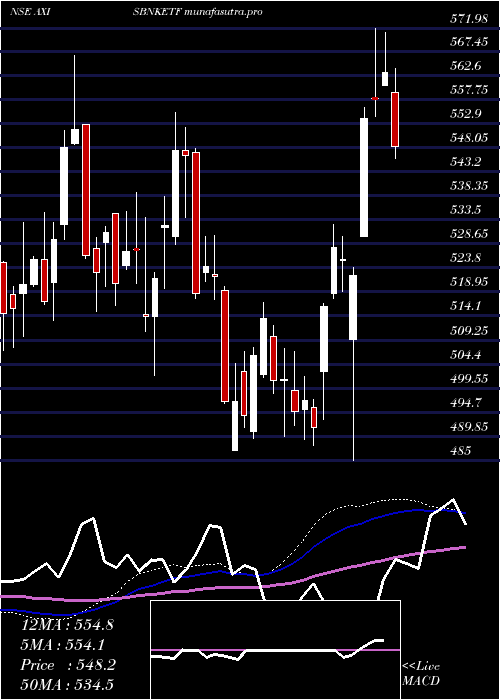
Weekly price and volumes for Axisamc Axisbnketf
| Date |
Closing |
Open |
Range |
Volume |
Tue 28 October 2025 |
597.48 (0.72%) |
595.00 |
593.42 - 599.34 |
0.066 times |
Fri 24 October 2025 |
593.20 (0.11%) |
595.55 |
516.94 - 602.50 |
0.4797 times |
Fri 17 October 2025 |
592.56 (1.78%) |
585.11 |
572.50 - 595.38 |
0.4386 times |
Fri 10 October 2025 |
582.20 (1.98%) |
568.07 |
568.07 - 584.01 |
2.5762 times |
Fri 03 October 2025 |
570.92 (1.95%) |
560.42 |
557.62 - 580.00 |
2.5882 times |
Fri 26 September 2025 |
560.01 (-2.01%) |
571.63 |
552.29 - 573.00 |
1.0341 times |
Fri 19 September 2025 |
571.52 (1.27%) |
565.07 |
563.30 - 574.77 |
1.919 times |
Fri 12 September 2025 |
564.38 (1.36%) |
555.71 |
555.39 - 564.61 |
0.5975 times |
Fri 05 September 2025 |
556.81 (0.67%) |
555.46 |
550.78 - 558.85 |
0.146 times |
Fri 29 August 2025 |
553.09 (-2.63%) |
568.03 |
552.50 - 569.53 |
0.1547 times |
Fri 22 August 2025 |
568.03 (-0.27%) |
574.28 |
558.83 - 577.24 |
0.2142 times |
Monthly price and charts AxisamcAxisbnketf Strong monthly Stock price targets for AxisamcAxisbnketf AXISBNKETF are 557.21 and 642.77 | Monthly Target 1 | 486.75 | | Monthly Target 2 | 542.11 | | Monthly Target 3 | 572.30666666667 | | Monthly Target 4 | 627.67 | | Monthly Target 5 | 657.87 |
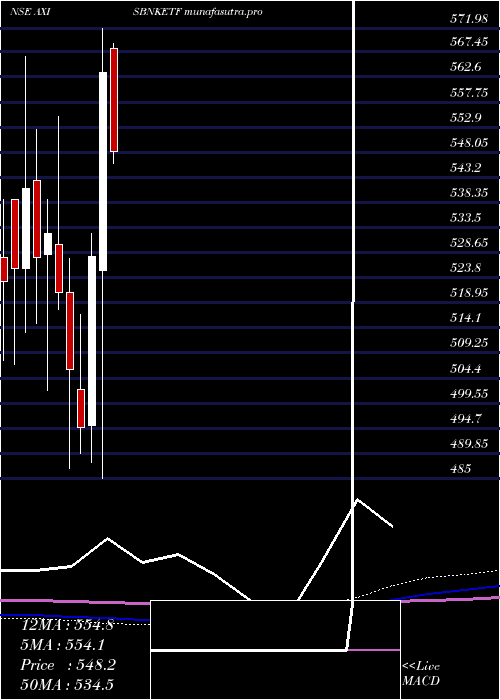
Monthly price and volumes Axisamc Axisbnketf
| Date |
Closing |
Open |
Range |
Volume |
Tue 28 October 2025 |
597.48 (6.16%) |
563.80 |
516.94 - 602.50 |
0.6699 times |
Tue 30 September 2025 |
562.81 (1.76%) |
555.46 |
550.78 - 574.77 |
0.4117 times |
Fri 29 August 2025 |
553.09 (-3.84%) |
574.57 |
552.50 - 577.24 |
0.0839 times |
Thu 31 July 2025 |
575.20 (-2.21%) |
588.20 |
570.20 - 589.90 |
0.6523 times |
Mon 30 June 2025 |
588.20 (3.25%) |
569.70 |
565.45 - 589.60 |
0.7767 times |
Fri 30 May 2025 |
569.70 (1.1%) |
568.15 |
545.87 - 570.31 |
0.701 times |
Wed 30 April 2025 |
563.48 (6.75%) |
525.25 |
485.00 - 571.98 |
2.4474 times |
Fri 28 March 2025 |
527.87 (6.68%) |
495.27 |
488.01 - 532.43 |
0.2686 times |
Fri 28 February 2025 |
494.82 (-2.22%) |
502.27 |
489.71 - 516.70 |
0.849 times |
Fri 31 January 2025 |
506.06 (-2.84%) |
520.85 |
486.99 - 527.50 |
3.1395 times |
Tue 31 December 2024 |
520.85 (-2.17%) |
530.18 |
517.60 - 555.00 |
0.4932 times |
DMA SMA EMA moving averages of Axisamc Axisbnketf AXISBNKETF
DMA (daily moving average) of Axisamc Axisbnketf AXISBNKETF
| DMA period | DMA value | | 5 day DMA | 596.3 | | 12 day DMA | 590.67 | | 20 day DMA | 583.11 | | 35 day DMA | 575.69 | | 50 day DMA | 571.91 | | 100 day DMA | 574.95 | | 150 day DMA | 566.57 | | 200 day DMA | 550.19 | EMA (exponential moving average) of Axisamc Axisbnketf AXISBNKETF
| EMA period | EMA current | EMA prev | EMA prev2 | | 5 day EMA | 595.7 | 594.81 | 593.47 | | 12 day EMA | 590.69 | 589.45 | 587.99 | | 20 day EMA | 585.74 | 584.5 | 583.13 | | 35 day EMA | 579.65 | 578.6 | 577.49 | | 50 day EMA | 573.96 | 573 | 572 |
SMA (simple moving average) of Axisamc Axisbnketf AXISBNKETF
| SMA period | SMA current | SMA prev | SMA prev2 | | 5 day SMA | 596.3 | 596.03 | 595.04 | | 12 day SMA | 590.67 | 589 | 587.22 | | 20 day SMA | 583.11 | 581.24 | 579.69 | | 35 day SMA | 575.69 | 574.53 | 573.35 | | 50 day SMA | 571.91 | 571.3 | 570.67 | | 100 day SMA | 574.95 | 574.67 | 574.38 | | 150 day SMA | 566.57 | 565.97 | 565.34 | | 200 day SMA | 550.19 | 549.76 | 549.38 |
|
|
