AvonmoreCap AVONMORE full analysis,charts,indicators,moving averages,SMA,DMA,EMA,ADX,MACD,RSIAvonmore Cap AVONMORE WideScreen charts, DMA,SMA,EMA technical analysis, forecast prediction, by indicators ADX,MACD,RSI,CCI NSE stock exchange
Daily price and charts and targets AvonmoreCap Strong Daily Stock price targets for AvonmoreCap AVONMORE are 17.58 and 17.97 | Daily Target 1 | 17.29 | | Daily Target 2 | 17.48 | | Daily Target 3 | 17.683333333333 | | Daily Target 4 | 17.87 | | Daily Target 5 | 18.07 |
Daily price and volume Avonmore Cap
| Date |
Closing |
Open |
Range |
Volume |
Tue 28 October 2025 |
17.66 (0.46%) |
17.59 |
17.50 - 17.89 |
0.475 times |
Mon 27 October 2025 |
17.58 (-1.51%) |
17.50 |
17.16 - 18.13 |
0.8429 times |
Fri 24 October 2025 |
17.85 (-0.72%) |
17.80 |
17.25 - 18.09 |
0.9968 times |
Thu 23 October 2025 |
17.98 (-0.99%) |
18.21 |
17.86 - 18.48 |
0.9627 times |
Tue 21 October 2025 |
18.16 (1.85%) |
17.83 |
17.83 - 18.51 |
0.3135 times |
Mon 20 October 2025 |
17.83 (-0.61%) |
18.28 |
17.70 - 18.30 |
0.7091 times |
Fri 17 October 2025 |
17.94 (-1.37%) |
18.45 |
17.86 - 18.45 |
1.0479 times |
Thu 16 October 2025 |
18.19 (-2.1%) |
18.26 |
18.08 - 18.57 |
0.4993 times |
Wed 15 October 2025 |
18.58 (3.8%) |
17.90 |
17.85 - 18.80 |
1.067 times |
Tue 14 October 2025 |
17.90 (-3.87%) |
18.85 |
17.64 - 18.85 |
3.0859 times |
Mon 13 October 2025 |
18.62 (-2.05%) |
18.84 |
18.57 - 18.88 |
0.8553 times |
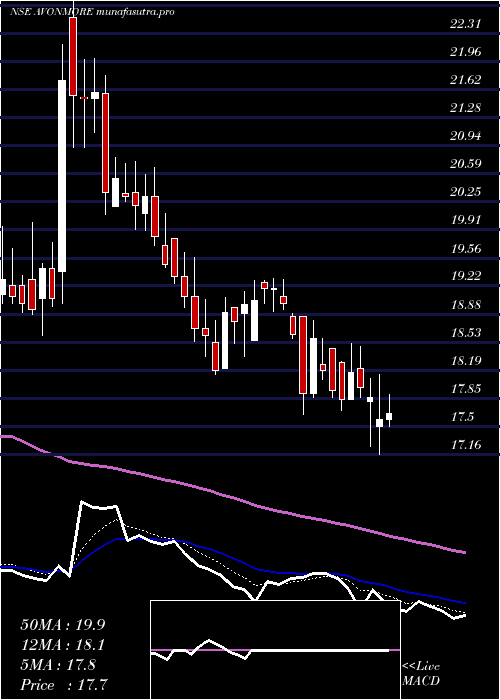
Weekly price and charts AvonmoreCap Strong weekly Stock price targets for AvonmoreCap AVONMORE are 17.41 and 18.38 | Weekly Target 1 | 16.68 | | Weekly Target 2 | 17.17 | | Weekly Target 3 | 17.65 | | Weekly Target 4 | 18.14 | | Weekly Target 5 | 18.62 |
Weekly price and volumes for Avonmore Cap
| Date |
Closing |
Open |
Range |
Volume |
Tue 28 October 2025 |
17.66 (-1.06%) |
17.50 |
17.16 - 18.13 |
0.1654 times |
Fri 24 October 2025 |
17.85 (-0.5%) |
18.28 |
17.25 - 18.51 |
0.3743 times |
Fri 17 October 2025 |
17.94 (-5.63%) |
18.84 |
17.64 - 18.88 |
0.8228 times |
Fri 10 October 2025 |
19.01 (1.22%) |
18.88 |
18.35 - 19.31 |
0.7938 times |
Fri 03 October 2025 |
18.78 (0.43%) |
18.70 |
18.13 - 19.08 |
0.6744 times |
Fri 26 September 2025 |
18.70 (-7.93%) |
20.31 |
18.54 - 20.67 |
1.0861 times |
Fri 19 September 2025 |
20.31 (-5.93%) |
21.57 |
19.90 - 21.80 |
0.9887 times |
Fri 12 September 2025 |
21.59 (11.12%) |
19.43 |
18.97 - 23.90 |
3.099 times |
Fri 05 September 2025 |
19.43 (1.15%) |
19.12 |
18.61 - 20.00 |
0.9029 times |
Fri 29 August 2025 |
19.21 (-5.23%) |
20.27 |
19.01 - 21.35 |
1.0926 times |
Fri 22 August 2025 |
20.27 (11.07%) |
18.34 |
18.25 - 22.22 |
5.513 times |
Monthly price and charts AvonmoreCap Strong monthly Stock price targets for AvonmoreCap AVONMORE are 16.34 and 18.49 | Monthly Target 1 | 15.89 | | Monthly Target 2 | 16.78 | | Monthly Target 3 | 18.043333333333 | | Monthly Target 4 | 18.93 | | Monthly Target 5 | 20.19 |
Monthly price and volumes Avonmore Cap
| Date |
Closing |
Open |
Range |
Volume |
Tue 28 October 2025 |
17.66 (-2.91%) |
18.21 |
17.16 - 19.31 |
0.2405 times |
Tue 30 September 2025 |
18.19 (-5.31%) |
19.12 |
18.13 - 23.90 |
0.6657 times |
Fri 29 August 2025 |
19.21 (2.56%) |
18.73 |
17.50 - 22.22 |
0.8389 times |
Thu 31 July 2025 |
18.73 (-31.44%) |
19.16 |
17.00 - 21.70 |
0.4037 times |
Tue 07 January 2025 |
27.32 (52.8%) |
17.89 |
17.84 - 27.32 |
3.7961 times |
Tue 31 December 2024 |
17.88 (1.3%) |
17.66 |
14.18 - 19.25 |
3.0921 times |
Fri 29 November 2024 |
17.65 (-86.53%) |
17.04 |
13.05 - 19.89 |
0.5234 times |
Tue 18 June 2024 |
131.06 (8.63%) |
126.00 |
104.95 - 138.00 |
0.0677 times |
Fri 31 May 2024 |
120.65 (9.28%) |
112.45 |
111.00 - 140.95 |
0.2678 times |
Tue 30 April 2024 |
110.40 (26.39%) |
92.70 |
89.65 - 117.30 |
0.104 times |
Thu 28 March 2024 |
87.35 (-15.52%) |
105.45 |
85.10 - 113.50 |
0.0649 times |
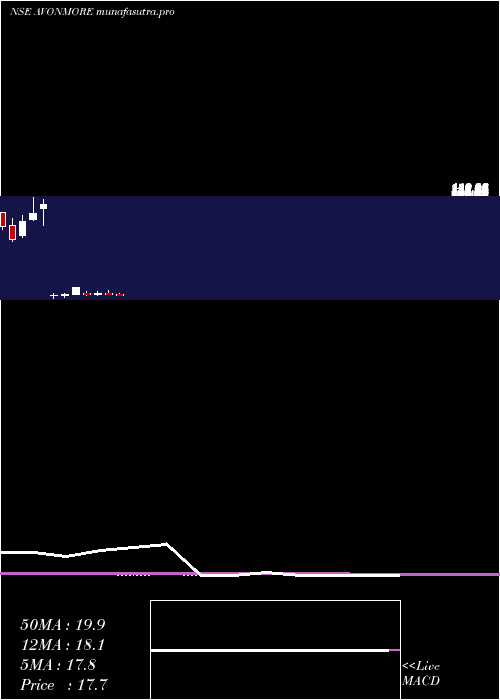
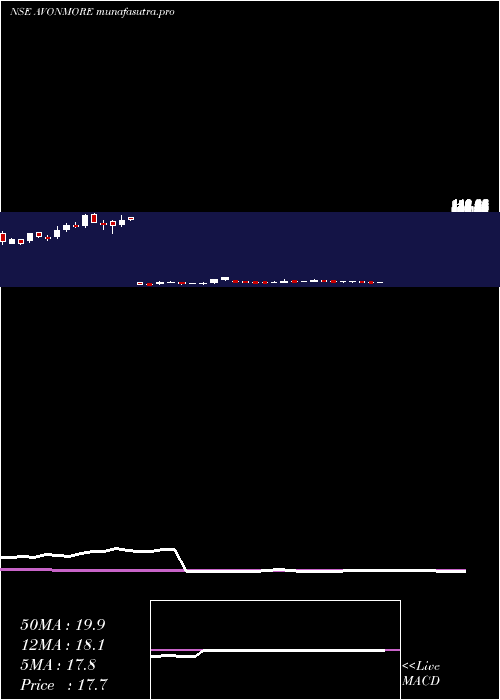
DMA SMA EMA moving averages of Avonmore Cap AVONMORE
DMA (daily moving average) of Avonmore Cap AVONMORE
| DMA period | DMA value | | 5 day DMA | 17.85 | | 12 day DMA | 18.11 | | 20 day DMA | 18.41 | | 35 day DMA | 19.19 | | 50 day DMA | 19.25 | | 100 day DMA | 18.68 | | 150 day DMA | 44.49 | | 200 day DMA | 58.78 | EMA (exponential moving average) of Avonmore Cap AVONMORE
| EMA period | EMA current | EMA prev | EMA prev2 | | 5 day EMA | 17.79 | 17.86 | 18 | | 12 day EMA | 18.1 | 18.18 | 18.29 | | 20 day EMA | 18.38 | 18.46 | 18.55 | | 35 day EMA | 18.68 | 18.74 | 18.81 | | 50 day EMA | 19.04 | 19.1 | 19.16 |
SMA (simple moving average) of Avonmore Cap AVONMORE
| SMA period | SMA current | SMA prev | SMA prev2 | | 5 day SMA | 17.85 | 17.88 | 17.95 | | 12 day SMA | 18.11 | 18.24 | 18.37 | | 20 day SMA | 18.41 | 18.46 | 18.54 | | 35 day SMA | 19.19 | 19.25 | 19.28 | | 50 day SMA | 19.25 | 19.28 | 19.29 | | 100 day SMA | 18.68 | 18.68 | 18.68 | | 150 day SMA | 44.49 | 45.06 | 45.62 | | 200 day SMA | 58.78 | 59.29 | 59.78 |
|
|
