AvantiFeeds AVANTIFEED full analysis,charts,indicators,moving averages,SMA,DMA,EMA,ADX,MACD,RSIAvanti Feeds AVANTIFEED WideScreen charts, DMA,SMA,EMA technical analysis, forecast prediction, by indicators ADX,MACD,RSI,CCI NSE stock exchange
operates under Other Food Products sector
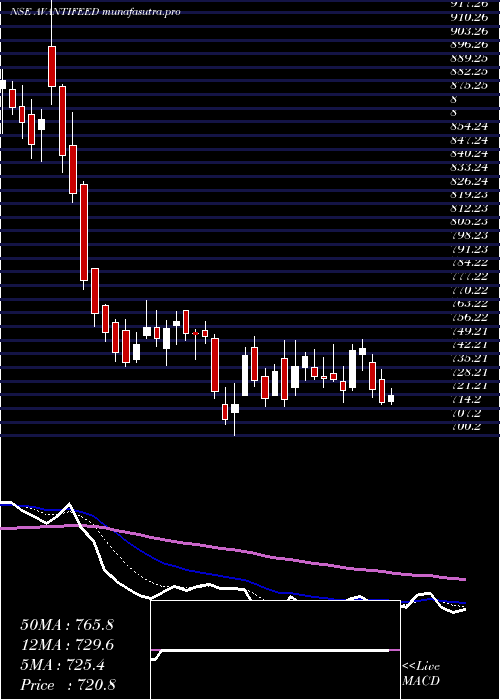
Daily price and charts and targets AvantiFeeds Strong Daily Stock price targets for AvantiFeeds AVANTIFEED are 704.68 and 721.78 | Daily Target 1 | 700.72 | | Daily Target 2 | 708.63 | | Daily Target 3 | 717.81666666667 | | Daily Target 4 | 725.73 | | Daily Target 5 | 734.92 |
Daily price and volume Avanti Feeds
| Date |
Closing |
Open |
Range |
Volume |
Wed 29 October 2025 |
716.55 (-0.75%) |
726.00 |
709.90 - 727.00 |
0.7286 times |
Tue 28 October 2025 |
721.95 (-0.48%) |
724.05 |
720.00 - 729.00 |
0.2968 times |
Mon 27 October 2025 |
725.40 (0.21%) |
723.90 |
708.30 - 729.00 |
0.587 times |
Fri 24 October 2025 |
723.90 (-0.62%) |
720.90 |
715.50 - 733.05 |
0.7531 times |
Thu 23 October 2025 |
728.45 (5.4%) |
750.00 |
720.00 - 760.00 |
4.8148 times |
Tue 21 October 2025 |
691.15 (-0.32%) |
696.70 |
674.80 - 702.00 |
0.1533 times |
Mon 20 October 2025 |
693.35 (0.99%) |
687.70 |
672.10 - 697.25 |
0.5854 times |
Fri 17 October 2025 |
686.55 (0%) |
686.55 |
680.10 - 695.00 |
0.6518 times |
Thu 16 October 2025 |
686.55 (4.06%) |
668.95 |
663.00 - 688.60 |
0.9671 times |
Wed 15 October 2025 |
659.75 (-0.2%) |
661.10 |
656.05 - 670.00 |
0.4621 times |
Tue 14 October 2025 |
661.10 (-0.86%) |
666.70 |
654.30 - 671.10 |
0.483 times |
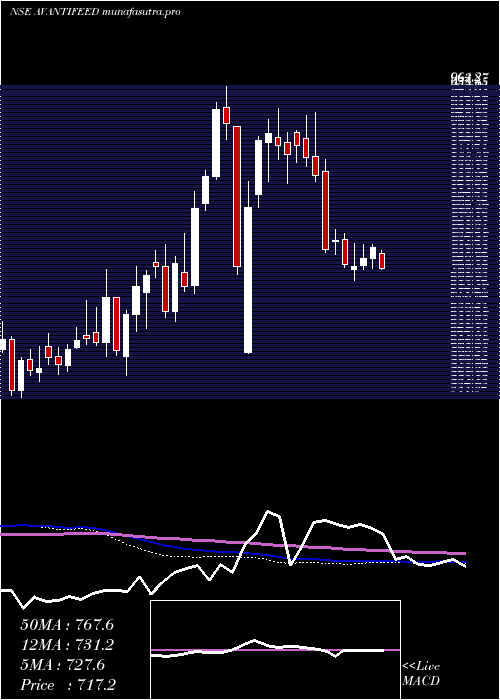
Weekly price and charts AvantiFeeds Strong weekly Stock price targets for AvantiFeeds AVANTIFEED are 702.08 and 722.78 | Weekly Target 1 | 697.25 | | Weekly Target 2 | 706.9 | | Weekly Target 3 | 717.95 | | Weekly Target 4 | 727.6 | | Weekly Target 5 | 738.65 |
Weekly price and volumes for Avanti Feeds
| Date |
Closing |
Open |
Range |
Volume |
Wed 29 October 2025 |
716.55 (-1.02%) |
723.90 |
708.30 - 729.00 |
0.2011 times |
Fri 24 October 2025 |
723.90 (5.44%) |
687.70 |
672.10 - 760.00 |
0.7868 times |
Fri 17 October 2025 |
686.55 (6.47%) |
657.45 |
648.00 - 695.00 |
0.5292 times |
Fri 10 October 2025 |
644.85 (-0.78%) |
653.00 |
636.00 - 660.90 |
0.2703 times |
Fri 03 October 2025 |
649.95 (0.54%) |
649.95 |
631.65 - 652.35 |
0.2117 times |
Fri 26 September 2025 |
646.45 (-11.83%) |
721.10 |
642.40 - 724.05 |
0.416 times |
Fri 19 September 2025 |
733.15 (2.54%) |
713.00 |
710.20 - 746.50 |
0.6129 times |
Fri 12 September 2025 |
715.00 (10.45%) |
652.80 |
648.55 - 768.00 |
5.8069 times |
Fri 05 September 2025 |
647.35 (0.86%) |
644.80 |
627.00 - 694.50 |
0.8567 times |
Fri 29 August 2025 |
641.85 (-0.14%) |
649.00 |
614.25 - 649.00 |
0.3083 times |
Fri 22 August 2025 |
642.75 (-1.28%) |
655.40 |
641.60 - 673.95 |
0.3113 times |
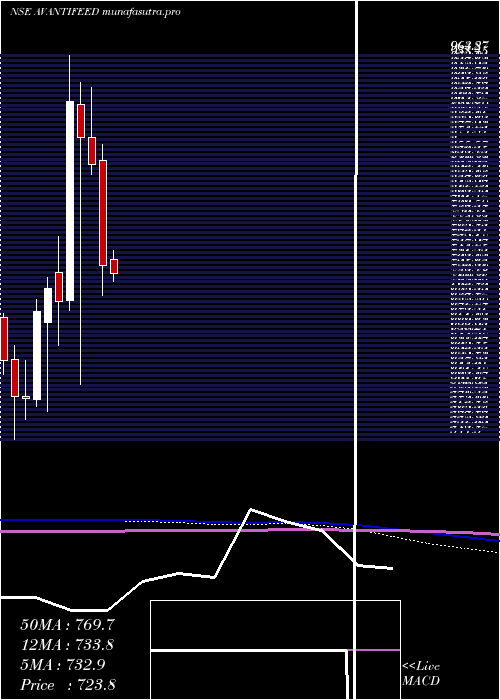
Monthly price and charts AvantiFeeds Strong monthly Stock price targets for AvantiFeeds AVANTIFEED are 676.28 and 800.28 | Monthly Target 1 | 580.18 | | Monthly Target 2 | 648.37 | | Monthly Target 3 | 704.18333333333 | | Monthly Target 4 | 772.37 | | Monthly Target 5 | 828.18 |
Monthly price and volumes Avanti Feeds
| Date |
Closing |
Open |
Range |
Volume |
Wed 29 October 2025 |
716.55 (11.82%) |
640.00 |
636.00 - 760.00 |
0.3495 times |
Tue 30 September 2025 |
640.80 (-0.16%) |
644.80 |
627.00 - 768.00 |
1.4366 times |
Fri 29 August 2025 |
641.85 (-5.76%) |
678.10 |
614.25 - 712.80 |
0.3855 times |
Thu 31 July 2025 |
681.10 (-7.08%) |
739.55 |
645.00 - 766.00 |
0.4663 times |
Mon 30 June 2025 |
733.00 (-13.15%) |
849.00 |
700.20 - 865.90 |
0.6231 times |
Fri 30 May 2025 |
844.00 (-3.44%) |
874.05 |
832.70 - 928.75 |
0.6415 times |
Wed 30 April 2025 |
874.05 (-4.33%) |
910.00 |
601.55 - 934.45 |
1.7851 times |
Fri 28 March 2025 |
913.65 (31.91%) |
694.50 |
683.10 - 964.20 |
2.1302 times |
Fri 28 February 2025 |
692.65 (-2.15%) |
724.95 |
644.55 - 765.00 |
0.6651 times |
Fri 31 January 2025 |
707.85 (3.83%) |
670.00 |
572.00 - 719.90 |
1.5169 times |
Tue 31 December 2024 |
681.75 (16.29%) |
585.00 |
577.50 - 694.95 |
1.3095 times |
DMA SMA EMA moving averages of Avanti Feeds AVANTIFEED
DMA (daily moving average) of Avanti Feeds AVANTIFEED
| DMA period | DMA value | | 5 day DMA | 723.25 | | 12 day DMA | 696.8 | | 20 day DMA | 676.36 | | 35 day DMA | 687.4 | | 50 day DMA | 676.3 | | 100 day DMA | 697.22 | | 150 day DMA | 750.32 | | 200 day DMA | 743.34 | EMA (exponential moving average) of Avanti Feeds AVANTIFEED
| EMA period | EMA current | EMA prev | EMA prev2 | | 5 day EMA | 716.25 | 716.1 | 713.18 | | 12 day EMA | 701.13 | 698.33 | 694.04 | | 20 day EMA | 691.54 | 688.91 | 685.43 | | 35 day EMA | 681.99 | 679.96 | 677.49 | | 50 day EMA | 679.14 | 677.61 | 675.8 |
SMA (simple moving average) of Avanti Feeds AVANTIFEED
| SMA period | SMA current | SMA prev | SMA prev2 | | 5 day SMA | 723.25 | 718.17 | 712.45 | | 12 day SMA | 696.8 | 690.82 | 684.35 | | 20 day SMA | 676.36 | 672.21 | 668.43 | | 35 day SMA | 687.4 | 685.78 | 683.65 | | 50 day SMA | 676.3 | 674.99 | 674.15 | | 100 day SMA | 697.22 | 697.59 | 698 | | 150 day SMA | 750.32 | 751.76 | 752.97 | | 200 day SMA | 743.34 | 743.04 | 742.63 |
|
|
