Avantel AVANTEL full analysis,charts,indicators,moving averages,SMA,DMA,EMA,ADX,MACD,RSIAvantel AVANTEL WideScreen charts, DMA,SMA,EMA technical analysis, forecast prediction, by indicators ADX,MACD,RSI,CCI NSE stock exchange
Daily price and charts and targets Avantel Strong Daily Stock price targets for Avantel AVANTEL are 143.6 and 148.88 | Daily Target 1 | 139.75 | | Daily Target 2 | 142.17 | | Daily Target 3 | 145.03333333333 | | Daily Target 4 | 147.45 | | Daily Target 5 | 150.31 |
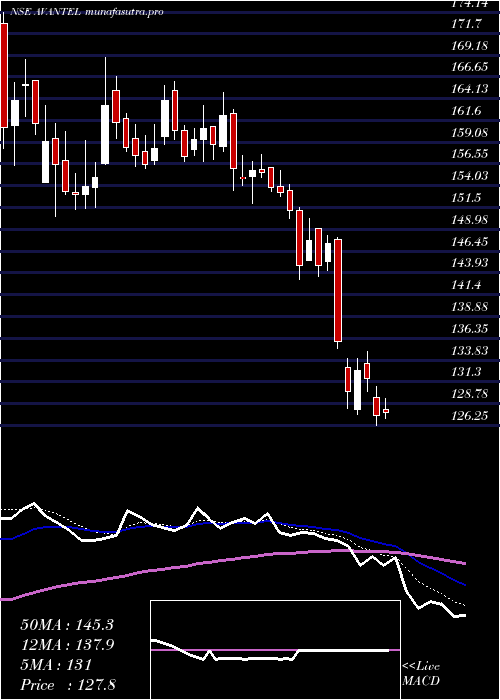
Daily price and volume Avantel
| Date |
Closing |
Open |
Range |
Volume |
Wed 10 December 2025 |
144.58 (1.43%) |
143.10 |
142.62 - 147.90 |
1.3966 times |
Tue 09 December 2025 |
142.54 (0.03%) |
140.60 |
136.92 - 143.75 |
1.5669 times |
Mon 08 December 2025 |
142.50 (-3.71%) |
148.19 |
141.00 - 150.15 |
1.1343 times |
Fri 05 December 2025 |
147.99 (-2.11%) |
149.99 |
147.20 - 151.50 |
0.6232 times |
Thu 04 December 2025 |
151.18 (-1.22%) |
153.20 |
145.35 - 154.88 |
0.9737 times |
Wed 03 December 2025 |
153.05 (-3.57%) |
158.99 |
152.20 - 159.39 |
0.8236 times |
Tue 02 December 2025 |
158.71 (1.48%) |
156.15 |
155.35 - 159.50 |
0.8984 times |
Mon 01 December 2025 |
156.40 (0.55%) |
157.00 |
156.00 - 160.56 |
0.9345 times |
Fri 28 November 2025 |
155.54 (0.63%) |
153.57 |
151.75 - 157.50 |
0.6875 times |
Thu 27 November 2025 |
154.57 (0.57%) |
154.80 |
154.00 - 158.39 |
0.9613 times |
Wed 26 November 2025 |
153.70 (1.65%) |
160.00 |
150.00 - 160.00 |
1.5141 times |
Weekly price and charts Avantel Strong weekly Stock price targets for Avantel AVANTEL are 134.14 and 147.37 | Weekly Target 1 | 130.65 | | Weekly Target 2 | 137.62 | | Weekly Target 3 | 143.88333333333 | | Weekly Target 4 | 150.85 | | Weekly Target 5 | 157.11 |
Weekly price and volumes for Avantel
| Date |
Closing |
Open |
Range |
Volume |
Wed 10 December 2025 |
144.58 (-2.3%) |
148.19 |
136.92 - 150.15 |
0.3219 times |
Fri 05 December 2025 |
147.99 (-4.85%) |
157.00 |
145.35 - 160.56 |
0.3341 times |
Fri 28 November 2025 |
155.54 (0.4%) |
155.99 |
148.00 - 160.00 |
0.4409 times |
Fri 21 November 2025 |
154.92 (-5.58%) |
164.49 |
154.15 - 165.80 |
0.3211 times |
Fri 14 November 2025 |
164.07 (0.85%) |
163.00 |
160.00 - 168.25 |
0.4013 times |
Fri 07 November 2025 |
162.69 (-5.16%) |
171.99 |
160.10 - 172.50 |
0.3852 times |
Fri 31 October 2025 |
171.55 (-4.41%) |
179.20 |
170.82 - 181.50 |
0.722 times |
Fri 24 October 2025 |
179.47 (-5.84%) |
179.34 |
160.50 - 188.89 |
2.3385 times |
Fri 17 October 2025 |
190.60 (-6.49%) |
203.00 |
182.12 - 203.38 |
1.9209 times |
Fri 10 October 2025 |
203.82 (0.76%) |
204.40 |
197.50 - 215.00 |
2.814 times |
Fri 03 October 2025 |
202.29 (13.05%) |
180.00 |
171.30 - 211.79 |
2.4976 times |

Monthly price and charts Avantel Strong monthly Stock price targets for Avantel AVANTEL are 128.93 and 152.57 | Monthly Target 1 | 123.71 | | Monthly Target 2 | 134.15 | | Monthly Target 3 | 147.35333333333 | | Monthly Target 4 | 157.79 | | Monthly Target 5 | 170.99 |
Monthly price and volumes Avantel
| Date |
Closing |
Open |
Range |
Volume |
Wed 10 December 2025 |
144.58 (-7.05%) |
157.00 |
136.92 - 160.56 |
0.1719 times |
Fri 28 November 2025 |
155.54 (-9.33%) |
171.99 |
148.00 - 172.50 |
0.4057 times |
Fri 31 October 2025 |
171.55 (-1.61%) |
174.85 |
160.50 - 215.00 |
2.5935 times |
Tue 30 September 2025 |
174.35 (16.42%) |
152.00 |
149.71 - 196.50 |
2.0646 times |
Fri 29 August 2025 |
149.76 (17.51%) |
128.05 |
123.25 - 153.74 |
0.4326 times |
Thu 31 July 2025 |
127.44 (-19.53%) |
159.79 |
126.25 - 166.14 |
0.5761 times |
Mon 30 June 2025 |
158.36 (12.65%) |
140.58 |
139.75 - 189.45 |
1.7644 times |
Fri 30 May 2025 |
140.58 (23.94%) |
117.80 |
102.76 - 152.70 |
1.2336 times |
Wed 30 April 2025 |
113.43 (0.15%) |
113.00 |
102.20 - 136.50 |
0.4267 times |
Fri 28 March 2025 |
113.26 (2.22%) |
110.80 |
103.81 - 125.60 |
0.331 times |
Fri 28 February 2025 |
110.80 (-18.96%) |
131.00 |
100.10 - 133.99 |
0.3587 times |

DMA SMA EMA moving averages of Avantel AVANTEL
DMA (daily moving average) of Avantel AVANTEL
| DMA period | DMA value | | 5 day DMA | 145.76 | | 12 day DMA | 151 | | 20 day DMA | 154.13 | | 35 day DMA | 161.36 | | 50 day DMA | 170.96 | | 100 day DMA | 161.61 | | 150 day DMA | 157.11 | | 200 day DMA | 147.05 | EMA (exponential moving average) of Avantel AVANTEL
| EMA period | EMA current | EMA prev | EMA prev2 | | 5 day EMA | 146 | 146.71 | 148.79 | | 12 day EMA | 150.19 | 151.21 | 152.78 | | 20 day EMA | 154.2 | 155.21 | 156.54 | | 35 day EMA | 162.05 | 163.08 | 164.29 | | 50 day EMA | 169.64 | 170.66 | 171.81 |
SMA (simple moving average) of Avantel AVANTEL
| SMA period | SMA current | SMA prev | SMA prev2 | | 5 day SMA | 145.76 | 147.45 | 150.69 | | 12 day SMA | 151 | 151.44 | 152.48 | | 20 day SMA | 154.13 | 155.12 | 156.22 | | 35 day SMA | 161.36 | 162.22 | 163.59 | | 50 day SMA | 170.96 | 171.65 | 172.4 | | 100 day SMA | 161.61 | 161.7 | 161.83 | | 150 day SMA | 157.11 | 156.87 | 156.68 | | 200 day SMA | 147.05 | 146.87 | 146.72 |
|
|
