AvalonTechnologies AVALON full analysis,charts,indicators,moving averages,SMA,DMA,EMA,ADX,MACD,RSIAvalon Technologies AVALON WideScreen charts, DMA,SMA,EMA technical analysis, forecast prediction, by indicators ADX,MACD,RSI,CCI NSE stock exchange
Daily price and charts and targets AvalonTechnologies Strong Daily Stock price targets for AvalonTechnologies AVALON are 1185.6 and 1238 | Daily Target 1 | 1144.67 | | Daily Target 2 | 1174.13 | | Daily Target 3 | 1197.0666666667 | | Daily Target 4 | 1226.53 | | Daily Target 5 | 1249.47 |
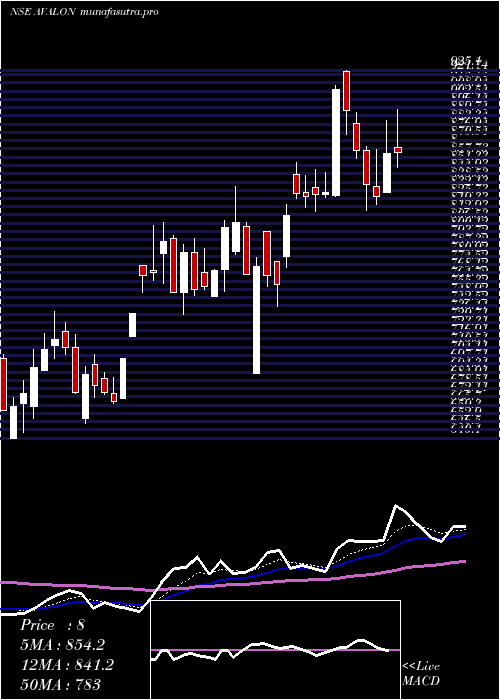
Daily price and volume Avalon Technologies
| Date |
Closing |
Open |
Range |
Volume |
Wed 29 October 2025 |
1203.60 (2.68%) |
1177.00 |
1167.60 - 1220.00 |
1.0359 times |
Tue 28 October 2025 |
1172.20 (3.2%) |
1135.00 |
1128.10 - 1179.90 |
1.0158 times |
Mon 27 October 2025 |
1135.90 (1.37%) |
1121.00 |
1106.10 - 1141.80 |
0.731 times |
Fri 24 October 2025 |
1120.60 (-0.46%) |
1130.00 |
1110.00 - 1151.90 |
0.8696 times |
Thu 23 October 2025 |
1125.80 (-7.33%) |
1230.40 |
1121.00 - 1233.50 |
1.4178 times |
Tue 21 October 2025 |
1214.90 (0.45%) |
1220.00 |
1202.50 - 1232.40 |
0.1681 times |
Mon 20 October 2025 |
1209.40 (2.93%) |
1180.50 |
1171.50 - 1232.00 |
1.5829 times |
Fri 17 October 2025 |
1175.00 (2.15%) |
1141.60 |
1141.60 - 1197.50 |
1.4957 times |
Thu 16 October 2025 |
1150.30 (0.52%) |
1150.00 |
1141.20 - 1174.90 |
0.7713 times |
Wed 15 October 2025 |
1144.40 (-0.41%) |
1150.00 |
1136.00 - 1168.00 |
0.9119 times |
Tue 14 October 2025 |
1149.10 (-5.72%) |
1218.80 |
1141.00 - 1236.00 |
2.0812 times |
Weekly price and charts AvalonTechnologies Strong weekly Stock price targets for AvalonTechnologies AVALON are 1154.85 and 1268.75 | Weekly Target 1 | 1062.67 | | Weekly Target 2 | 1133.13 | | Weekly Target 3 | 1176.5666666667 | | Weekly Target 4 | 1247.03 | | Weekly Target 5 | 1290.47 |
Weekly price and volumes for Avalon Technologies
| Date |
Closing |
Open |
Range |
Volume |
Wed 29 October 2025 |
1203.60 (7.41%) |
1121.00 |
1106.10 - 1220.00 |
0.3032 times |
Fri 24 October 2025 |
1120.60 (-4.63%) |
1180.50 |
1110.00 - 1233.50 |
0.4401 times |
Fri 17 October 2025 |
1175.00 (-4.5%) |
1213.00 |
1136.00 - 1261.10 |
0.7233 times |
Fri 10 October 2025 |
1230.40 (16.6%) |
1061.80 |
1039.20 - 1318.00 |
3.9802 times |
Fri 03 October 2025 |
1055.20 (6.16%) |
988.65 |
970.90 - 1061.00 |
0.6637 times |
Fri 26 September 2025 |
993.95 (2.04%) |
961.00 |
953.55 - 1024.00 |
0.88 times |
Fri 19 September 2025 |
974.10 (0.52%) |
970.05 |
949.60 - 1009.90 |
0.8616 times |
Fri 12 September 2025 |
969.10 (5%) |
934.95 |
900.00 - 990.85 |
1.0698 times |
Fri 05 September 2025 |
922.95 (11.11%) |
832.20 |
832.20 - 926.90 |
0.6526 times |
Fri 29 August 2025 |
830.70 (-2.74%) |
871.25 |
826.00 - 882.25 |
0.4255 times |
Fri 22 August 2025 |
854.10 (1.95%) |
844.00 |
841.00 - 875.00 |
0.357 times |

Monthly price and charts AvalonTechnologies Strong monthly Stock price targets for AvalonTechnologies AVALON are 1101.85 and 1419.75 | Monthly Target 1 | 856 | | Monthly Target 2 | 1029.8 | | Monthly Target 3 | 1173.9 | | Monthly Target 4 | 1347.7 | | Monthly Target 5 | 1491.8 |
Monthly price and volumes Avalon Technologies
| Date |
Closing |
Open |
Range |
Volume |
Wed 29 October 2025 |
1203.60 (19.27%) |
1010.90 |
1000.10 - 1318.00 |
1.212 times |
Tue 30 September 2025 |
1009.15 (21.48%) |
832.20 |
832.20 - 1024.00 |
0.7642 times |
Fri 29 August 2025 |
830.70 (-1.79%) |
849.90 |
826.00 - 965.90 |
0.9661 times |
Thu 31 July 2025 |
845.85 (0.29%) |
847.00 |
790.95 - 891.50 |
0.5099 times |
Mon 30 June 2025 |
843.40 (-1.92%) |
858.00 |
783.45 - 884.05 |
0.7853 times |
Fri 30 May 2025 |
859.90 (-0.14%) |
856.50 |
774.00 - 928.40 |
0.9506 times |
Wed 30 April 2025 |
861.10 (13.67%) |
750.00 |
689.90 - 925.10 |
0.9477 times |
Fri 28 March 2025 |
757.55 (14.01%) |
666.95 |
644.15 - 807.20 |
0.7975 times |
Fri 28 February 2025 |
664.45 (0.64%) |
690.95 |
603.00 - 766.80 |
1.1 times |
Fri 31 January 2025 |
660.25 (-31.51%) |
972.00 |
598.00 - 1023.00 |
1.9668 times |
Tue 31 December 2024 |
964.00 (-0.09%) |
963.95 |
830.20 - 1073.75 |
1.6144 times |

DMA SMA EMA moving averages of Avalon Technologies AVALON
DMA (daily moving average) of Avalon Technologies AVALON
| DMA period | DMA value | | 5 day DMA | 1151.62 | | 12 day DMA | 1168.33 | | 20 day DMA | 1158.64 | | 35 day DMA | 1081.09 | | 50 day DMA | 1015.26 | | 100 day DMA | 933.1 | | 150 day DMA | 900.21 | | 200 day DMA | 854.13 | EMA (exponential moving average) of Avalon Technologies AVALON
| EMA period | EMA current | EMA prev | EMA prev2 | | 5 day EMA | 1171.89 | 1156.03 | 1147.95 | | 12 day EMA | 1161.89 | 1154.31 | 1151.06 | | 20 day EMA | 1138.74 | 1131.92 | 1127.68 | | 35 day EMA | 1084.56 | 1077.55 | 1071.98 | | 50 day EMA | 1017.76 | 1010.18 | 1003.57 |
SMA (simple moving average) of Avalon Technologies AVALON
| SMA period | SMA current | SMA prev | SMA prev2 | | 5 day SMA | 1151.62 | 1153.88 | 1161.32 | | 12 day SMA | 1168.33 | 1170.57 | 1175.82 | | 20 day SMA | 1158.64 | 1148.99 | 1140.08 | | 35 day SMA | 1081.09 | 1073.23 | 1066.11 | | 50 day SMA | 1015.26 | 1007.95 | 1001.98 | | 100 day SMA | 933.1 | 929.71 | 926.58 | | 150 day SMA | 900.21 | 897.3 | 894.39 | | 200 day SMA | 854.13 | 852.85 | 851.59 |
|
|
