AutomotiveAxles AUTOAXLES full analysis,charts,indicators,moving averages,SMA,DMA,EMA,ADX,MACD,RSIAutomotive Axles AUTOAXLES WideScreen charts, DMA,SMA,EMA technical analysis, forecast prediction, by indicators ADX,MACD,RSI,CCI NSE stock exchange
operates under Auto Parts & Equipment sector
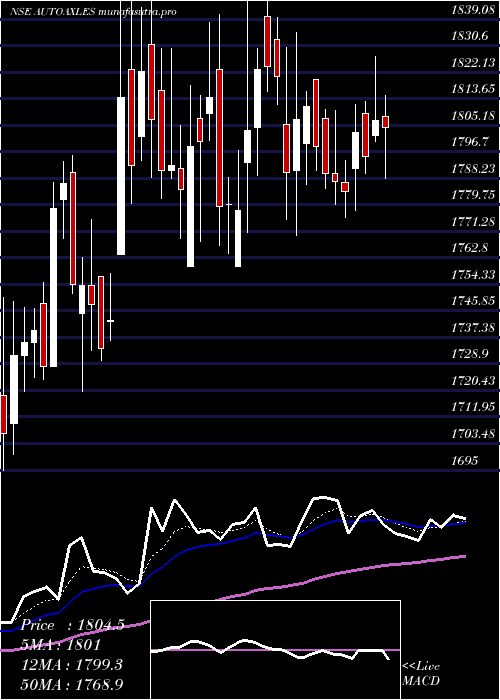
Daily price and charts and targets AutomotiveAxles Strong Daily Stock price targets for AutomotiveAxles AUTOAXLES are 1713.4 and 1749.2 | Daily Target 1 | 1705.03 | | Daily Target 2 | 1721.77 | | Daily Target 3 | 1740.8333333333 | | Daily Target 4 | 1757.57 | | Daily Target 5 | 1776.63 |
Daily price and volume Automotive Axles
| Date |
Closing |
Open |
Range |
Volume |
Wed 29 October 2025 |
1738.50 (-0.25%) |
1752.00 |
1724.10 - 1759.90 |
1.2824 times |
Tue 28 October 2025 |
1742.80 (0.43%) |
1742.00 |
1731.60 - 1753.00 |
0.8174 times |
Mon 27 October 2025 |
1735.30 (0.78%) |
1737.00 |
1720.40 - 1742.00 |
0.9123 times |
Fri 24 October 2025 |
1721.80 (1.18%) |
1703.30 |
1695.80 - 1729.00 |
0.6877 times |
Thu 23 October 2025 |
1701.70 (-0.5%) |
1712.00 |
1682.00 - 1730.00 |
1.722 times |
Tue 21 October 2025 |
1710.30 (-0.02%) |
1725.00 |
1700.00 - 1725.00 |
0.2742 times |
Mon 20 October 2025 |
1710.60 (0.64%) |
1701.10 |
1701.10 - 1717.00 |
0.5934 times |
Fri 17 October 2025 |
1699.80 (-0.25%) |
1706.00 |
1690.00 - 1715.00 |
1.4004 times |
Thu 16 October 2025 |
1704.10 (0.48%) |
1704.90 |
1680.00 - 1716.90 |
0.6979 times |
Wed 15 October 2025 |
1696.00 (0.18%) |
1693.00 |
1681.30 - 1752.50 |
1.6123 times |
Tue 14 October 2025 |
1693.00 (-0.72%) |
1714.20 |
1678.00 - 1714.20 |
0.9943 times |
Weekly price and charts AutomotiveAxles Strong weekly Stock price targets for AutomotiveAxles AUTOAXLES are 1729.45 and 1768.95 | Weekly Target 1 | 1700.1 | | Weekly Target 2 | 1719.3 | | Weekly Target 3 | 1739.6 | | Weekly Target 4 | 1758.8 | | Weekly Target 5 | 1779.1 |
Weekly price and volumes for Automotive Axles
| Date |
Closing |
Open |
Range |
Volume |
Wed 29 October 2025 |
1738.50 (0.97%) |
1737.00 |
1720.40 - 1759.90 |
0.3715 times |
Fri 24 October 2025 |
1721.80 (1.29%) |
1701.10 |
1682.00 - 1730.00 |
0.4043 times |
Fri 17 October 2025 |
1699.80 (-1.39%) |
1732.90 |
1678.00 - 1752.50 |
0.6774 times |
Fri 10 October 2025 |
1723.80 (-2.62%) |
1779.50 |
1710.10 - 1786.00 |
0.4068 times |
Fri 03 October 2025 |
1770.20 (1.36%) |
1763.90 |
1715.00 - 1781.90 |
0.472 times |
Fri 26 September 2025 |
1746.40 (-0.75%) |
1768.70 |
1706.70 - 1848.80 |
1.7689 times |
Fri 19 September 2025 |
1759.60 (2.09%) |
1732.70 |
1723.00 - 1800.30 |
1.3928 times |
Fri 12 September 2025 |
1723.60 (0.25%) |
1711.00 |
1679.60 - 1758.40 |
1.6202 times |
Fri 05 September 2025 |
1719.30 (-0.69%) |
1739.70 |
1715.00 - 1803.20 |
1.9808 times |
Fri 29 August 2025 |
1731.30 (-2.14%) |
1770.00 |
1661.00 - 1785.00 |
0.9052 times |
Fri 22 August 2025 |
1769.20 (8.24%) |
1636.00 |
1635.70 - 1781.10 |
5.2357 times |
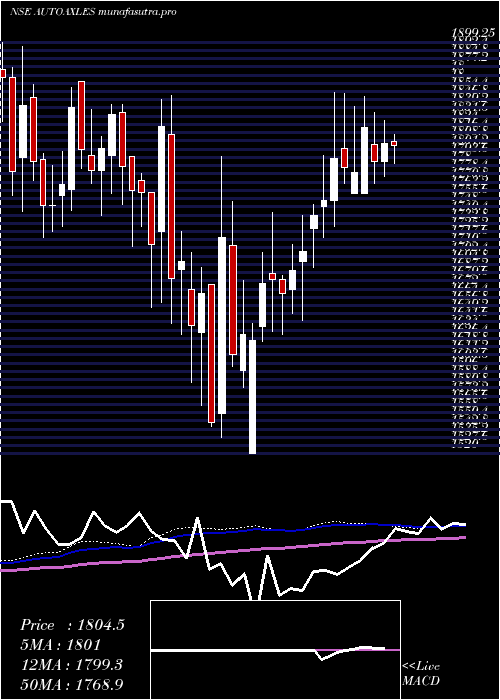
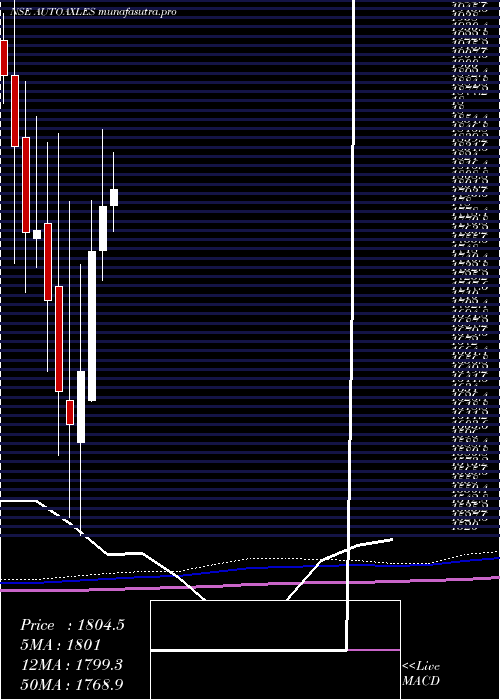
Monthly price and charts AutomotiveAxles Strong monthly Stock price targets for AutomotiveAxles AUTOAXLES are 1708.25 and 1816.25 | Monthly Target 1 | 1626.17 | | Monthly Target 2 | 1682.33 | | Monthly Target 3 | 1734.1666666667 | | Monthly Target 4 | 1790.33 | | Monthly Target 5 | 1842.17 |
Monthly price and volumes Automotive Axles
| Date |
Closing |
Open |
Range |
Volume |
Wed 29 October 2025 |
1738.50 (0.64%) |
1730.30 |
1678.00 - 1786.00 |
0.2803 times |
Tue 30 September 2025 |
1727.40 (-0.23%) |
1739.70 |
1679.60 - 1848.80 |
0.9666 times |
Fri 29 August 2025 |
1731.30 (-7.85%) |
1880.00 |
1624.90 - 1931.80 |
1.5762 times |
Thu 31 July 2025 |
1878.70 (4.94%) |
1791.00 |
1732.50 - 1982.20 |
1.8832 times |
Mon 30 June 2025 |
1790.20 (2.07%) |
1754.00 |
1730.00 - 1854.00 |
0.8853 times |
Fri 30 May 2025 |
1753.90 (5.99%) |
1631.00 |
1630.20 - 1795.60 |
1.1179 times |
Wed 30 April 2025 |
1654.80 (2.69%) |
1596.90 |
1520.00 - 1742.80 |
0.6714 times |
Fri 28 March 2025 |
1611.50 (-1.66%) |
1631.65 |
1535.00 - 1794.95 |
1.1493 times |
Fri 28 February 2025 |
1638.70 (-4.33%) |
1725.00 |
1585.95 - 1850.70 |
0.7462 times |
Fri 31 January 2025 |
1712.90 (-3.29%) |
1776.30 |
1655.00 - 1842.90 |
0.7237 times |
Tue 31 December 2024 |
1771.15 (0.13%) |
1764.15 |
1740.15 - 1864.00 |
0.8084 times |
DMA SMA EMA moving averages of Automotive Axles AUTOAXLES
DMA (daily moving average) of Automotive Axles AUTOAXLES
| DMA period | DMA value | | 5 day DMA | 1728.02 | | 12 day DMA | 1713.26 | | 20 day DMA | 1724.43 | | 35 day DMA | 1738.5 | | 50 day DMA | 1737.82 | | 100 day DMA | 1765.68 | | 150 day DMA | 1740.32 | | 200 day DMA | 1730.46 | EMA (exponential moving average) of Automotive Axles AUTOAXLES
| EMA period | EMA current | EMA prev | EMA prev2 | | 5 day EMA | 1730.85 | 1727.02 | 1719.13 | | 12 day EMA | 1724.61 | 1722.08 | 1718.31 | | 20 day EMA | 1726.2 | 1724.91 | 1723.03 | | 35 day EMA | 1725.64 | 1724.88 | 1723.82 | | 50 day EMA | 1729.31 | 1728.94 | 1728.37 |
SMA (simple moving average) of Automotive Axles AUTOAXLES
| SMA period | SMA current | SMA prev | SMA prev2 | | 5 day SMA | 1728.02 | 1722.38 | 1715.94 | | 12 day SMA | 1713.26 | 1712.03 | 1710.52 | | 20 day SMA | 1724.43 | 1724.36 | 1724.54 | | 35 day SMA | 1738.5 | 1737.47 | 1736.8 | | 50 day SMA | 1737.82 | 1735.74 | 1733.87 | | 100 day SMA | 1765.68 | 1766.44 | 1766.44 | | 150 day SMA | 1740.32 | 1740.31 | 1739.58 | | 200 day SMA | 1730.46 | 1730.8 | 1731.13 |
|
|
