AurumProptech AURUM full analysis,charts,indicators,moving averages,SMA,DMA,EMA,ADX,MACD,RSIAurum Proptech AURUM WideScreen charts, DMA,SMA,EMA technical analysis, forecast prediction, by indicators ADX,MACD,RSI,CCI NSE stock exchange
Daily price and charts and targets AurumProptech Strong Daily Stock price targets for AurumProptech AURUM are 169.02 and 172.14 | Daily Target 1 | 168.34 | | Daily Target 2 | 169.69 | | Daily Target 3 | 171.45666666667 | | Daily Target 4 | 172.81 | | Daily Target 5 | 174.58 |
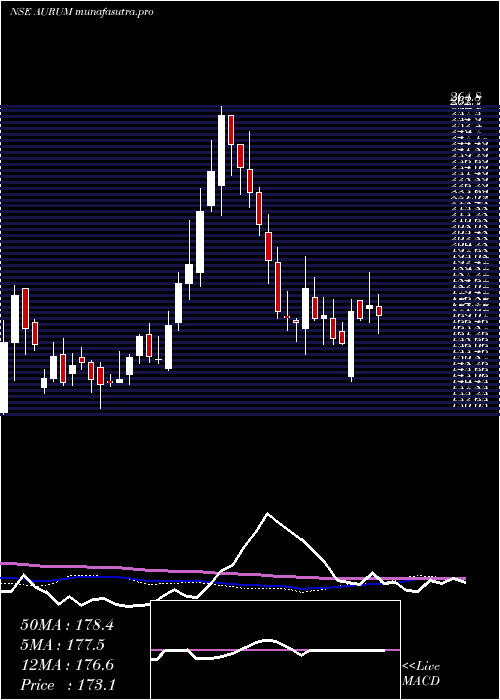
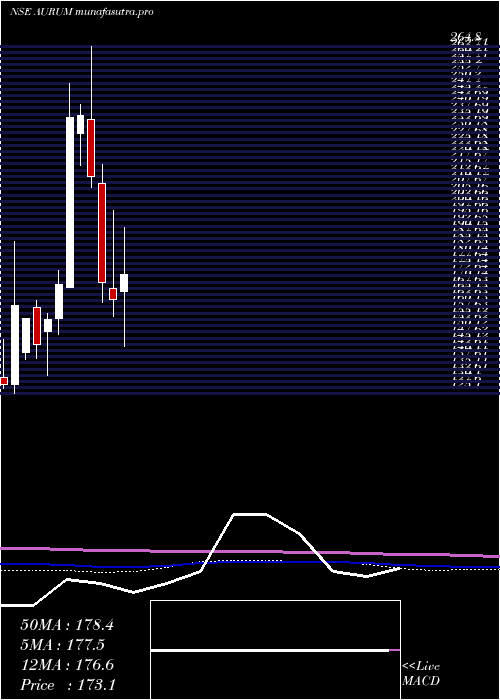
Daily price and volume Aurum Proptech
| Date |
Closing |
Open |
Range |
Volume |
Tue 28 October 2025 |
171.05 (-0.67%) |
172.55 |
170.10 - 173.22 |
0.222 times |
Mon 27 October 2025 |
172.20 (-2.18%) |
174.61 |
171.07 - 176.26 |
0.2708 times |
Fri 24 October 2025 |
176.04 (0.57%) |
176.00 |
171.05 - 179.35 |
1.1453 times |
Thu 23 October 2025 |
175.05 (-3.04%) |
180.54 |
173.00 - 181.21 |
0.2668 times |
Tue 21 October 2025 |
180.54 (-0.52%) |
179.00 |
176.50 - 183.49 |
0.3301 times |
Mon 20 October 2025 |
181.48 (1.13%) |
179.48 |
175.50 - 183.40 |
0.8208 times |
Fri 17 October 2025 |
179.46 (0.88%) |
182.00 |
175.05 - 183.00 |
2.0232 times |
Thu 16 October 2025 |
177.90 (7.23%) |
165.90 |
165.85 - 179.95 |
4.1129 times |
Wed 15 October 2025 |
165.90 (0.3%) |
166.23 |
162.00 - 167.86 |
0.3856 times |
Tue 14 October 2025 |
165.41 (-1.18%) |
168.34 |
164.00 - 168.86 |
0.4224 times |
Mon 13 October 2025 |
167.39 (0.19%) |
167.08 |
166.14 - 170.00 |
0.3821 times |

Weekly price and charts AurumProptech Strong weekly Stock price targets for AurumProptech AURUM are 167.5 and 173.66 | Weekly Target 1 | 166.31 | | Weekly Target 2 | 168.68 | | Weekly Target 3 | 172.47 | | Weekly Target 4 | 174.84 | | Weekly Target 5 | 178.63 |
Weekly price and volumes for Aurum Proptech
| Date |
Closing |
Open |
Range |
Volume |
Tue 28 October 2025 |
171.05 (-2.83%) |
174.61 |
170.10 - 176.26 |
0.045 times |
Fri 24 October 2025 |
176.04 (-1.91%) |
179.48 |
171.05 - 183.49 |
0.234 times |
Fri 17 October 2025 |
179.46 (7.41%) |
167.08 |
162.00 - 183.00 |
0.669 times |
Fri 10 October 2025 |
167.08 (-0.87%) |
168.55 |
163.55 - 180.99 |
0.2497 times |
Fri 03 October 2025 |
168.54 (-1.5%) |
178.81 |
166.25 - 186.40 |
1.1245 times |
Fri 26 September 2025 |
171.11 (1.66%) |
169.16 |
159.85 - 184.50 |
6.9188 times |
Fri 19 September 2025 |
168.32 (-1.53%) |
170.93 |
167.50 - 177.37 |
0.1555 times |
Fri 12 September 2025 |
170.93 (-2.02%) |
181.00 |
170.00 - 181.00 |
0.1372 times |
Fri 05 September 2025 |
174.45 (5.55%) |
165.00 |
164.41 - 191.50 |
0.3878 times |
Fri 29 August 2025 |
165.27 (-6.8%) |
177.12 |
164.40 - 178.64 |
0.0784 times |
Fri 22 August 2025 |
177.32 (1.4%) |
174.88 |
174.88 - 180.90 |
0.0966 times |
Monthly price and charts AurumProptech Strong monthly Stock price targets for AurumProptech AURUM are 155.78 and 177.27 | Monthly Target 1 | 150.69 | | Monthly Target 2 | 160.87 | | Monthly Target 3 | 172.18 | | Monthly Target 4 | 182.36 | | Monthly Target 5 | 193.67 |
Monthly price and volumes Aurum Proptech
| Date |
Closing |
Open |
Range |
Volume |
Tue 28 October 2025 |
171.05 (0.87%) |
171.10 |
162.00 - 183.49 |
0.7653 times |
Tue 30 September 2025 |
169.57 (2.6%) |
165.00 |
159.85 - 191.50 |
4.8235 times |
Fri 29 August 2025 |
165.27 (-14.75%) |
193.87 |
164.40 - 197.90 |
0.3667 times |
Thu 31 July 2025 |
193.87 (-2.56%) |
196.95 |
187.40 - 225.70 |
1.2295 times |
Mon 30 June 2025 |
198.96 (-1.31%) |
203.00 |
192.06 - 221.39 |
0.8273 times |
Fri 30 May 2025 |
201.61 (16.45%) |
170.25 |
157.20 - 212.00 |
0.4589 times |
Wed 30 April 2025 |
173.13 (6.17%) |
166.36 |
144.40 - 192.00 |
0.1924 times |
Fri 28 March 2025 |
163.07 (-4.06%) |
167.40 |
156.15 - 199.00 |
0.272 times |
Fri 28 February 2025 |
169.97 (-20.13%) |
209.65 |
162.00 - 217.48 |
0.3753 times |
Fri 31 January 2025 |
212.80 (-10.2%) |
235.40 |
208.00 - 264.80 |
0.6891 times |
Tue 31 December 2024 |
236.96 (0.25%) |
230.00 |
216.85 - 241.50 |
0.082 times |
DMA SMA EMA moving averages of Aurum Proptech AURUM
DMA (daily moving average) of Aurum Proptech AURUM
| DMA period | DMA value | | 5 day DMA | 174.98 | | 12 day DMA | 173.29 | | 20 day DMA | 171.58 | | 35 day DMA | 170.87 | | 50 day DMA | 171.84 | | 100 day DMA | 183.91 | | 150 day DMA | 182.28 | | 200 day DMA | 186.95 | EMA (exponential moving average) of Aurum Proptech AURUM
| EMA period | EMA current | EMA prev | EMA prev2 | | 5 day EMA | 173.72 | 175.05 | 176.48 | | 12 day EMA | 173.4 | 173.83 | 174.13 | | 20 day EMA | 172.58 | 172.74 | 172.8 | | 35 day EMA | 172.66 | 172.75 | 172.78 | | 50 day EMA | 172.84 | 172.91 | 172.94 |
SMA (simple moving average) of Aurum Proptech AURUM
| SMA period | SMA current | SMA prev | SMA prev2 | | 5 day SMA | 174.98 | 177.06 | 178.51 | | 12 day SMA | 173.29 | 172.81 | 172.28 | | 20 day SMA | 171.58 | 171.58 | 171 | | 35 day SMA | 170.87 | 170.96 | 171.05 | | 50 day SMA | 171.84 | 171.97 | 172.13 | | 100 day SMA | 183.91 | 184.17 | 184.43 | | 150 day SMA | 182.28 | 182.29 | 182.25 | | 200 day SMA | 186.95 | 187.3 | 187.74 |
|
|
