AdaniTotal ATGL full analysis,charts,indicators,moving averages,SMA,DMA,EMA,ADX,MACD,RSIAdani Total ATGL WideScreen charts, DMA,SMA,EMA technical analysis, forecast prediction, by indicators ADX,MACD,RSI,CCI NSE stock exchange
Daily price and charts and targets AdaniTotal Strong Daily Stock price targets for AdaniTotal ATGL are 616.6 and 622.8 | Daily Target 1 | 615.13 | | Daily Target 2 | 618.07 | | Daily Target 3 | 621.33333333333 | | Daily Target 4 | 624.27 | | Daily Target 5 | 627.53 |
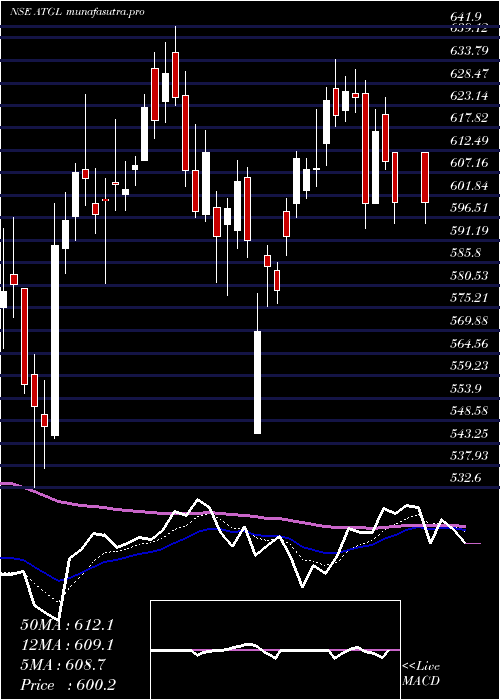
Daily price and volume Adani Total
| Date |
Closing |
Open |
Range |
Volume |
Tue 28 October 2025 |
621.00 (0.31%) |
622.35 |
618.40 - 624.60 |
0.7215 times |
Mon 27 October 2025 |
619.05 (-0.56%) |
623.00 |
618.00 - 624.00 |
0.6208 times |
Fri 24 October 2025 |
622.55 (-0.14%) |
620.20 |
618.00 - 624.90 |
0.907 times |
Thu 23 October 2025 |
623.40 (0.02%) |
629.75 |
622.00 - 629.75 |
0.9028 times |
Tue 21 October 2025 |
623.30 (0.42%) |
624.00 |
621.00 - 627.35 |
0.1984 times |
Mon 20 October 2025 |
620.70 (0.15%) |
621.90 |
617.60 - 623.70 |
0.9873 times |
Fri 17 October 2025 |
619.80 (-0.3%) |
622.15 |
617.00 - 639.95 |
2.3409 times |
Thu 16 October 2025 |
621.65 (0.43%) |
621.95 |
620.30 - 628.25 |
0.8338 times |
Wed 15 October 2025 |
619.00 (0.36%) |
619.20 |
613.70 - 624.70 |
1.2065 times |
Tue 14 October 2025 |
616.75 (-1.38%) |
626.00 |
615.10 - 631.90 |
1.281 times |
Mon 13 October 2025 |
625.35 (-0.43%) |
625.00 |
620.15 - 628.40 |
1.174 times |
Weekly price and charts AdaniTotal Strong weekly Stock price targets for AdaniTotal ATGL are 616.2 and 622.8 | Weekly Target 1 | 614.6 | | Weekly Target 2 | 617.8 | | Weekly Target 3 | 621.2 | | Weekly Target 4 | 624.4 | | Weekly Target 5 | 627.8 |
Weekly price and volumes for Adani Total
| Date |
Closing |
Open |
Range |
Volume |
Tue 28 October 2025 |
621.00 (-0.25%) |
623.00 |
618.00 - 624.60 |
0.0689 times |
Fri 24 October 2025 |
622.55 (0.44%) |
621.90 |
617.60 - 629.75 |
0.1539 times |
Fri 17 October 2025 |
619.80 (-1.31%) |
625.00 |
613.70 - 639.95 |
0.3511 times |
Fri 10 October 2025 |
628.05 (-1.44%) |
640.00 |
624.05 - 655.70 |
0.3967 times |
Fri 03 October 2025 |
637.25 (-1.85%) |
658.80 |
618.00 - 658.80 |
0.5879 times |
Fri 26 September 2025 |
649.25 (-0.34%) |
656.00 |
646.50 - 798.00 |
6.0246 times |
Fri 19 September 2025 |
651.45 (7.57%) |
607.00 |
603.30 - 687.75 |
1.4869 times |
Fri 12 September 2025 |
605.60 (2.57%) |
593.10 |
590.00 - 628.95 |
0.2798 times |
Fri 05 September 2025 |
590.40 (-0.12%) |
593.90 |
588.20 - 604.95 |
0.1379 times |
Fri 29 August 2025 |
591.10 (-4.31%) |
620.00 |
583.75 - 644.50 |
0.5123 times |
Fri 22 August 2025 |
617.75 (1.71%) |
612.00 |
609.05 - 635.00 |
0.1904 times |

Monthly price and charts AdaniTotal Strong monthly Stock price targets for AdaniTotal ATGL are 596.35 and 638.35 | Monthly Target 1 | 588.13 | | Monthly Target 2 | 604.57 | | Monthly Target 3 | 630.13333333333 | | Monthly Target 4 | 646.57 | | Monthly Target 5 | 672.13 |
Monthly price and volumes Adani Total
| Date |
Closing |
Open |
Range |
Volume |
Tue 28 October 2025 |
621.00 (-0.69%) |
630.05 |
613.70 - 655.70 |
0.4874 times |
Tue 30 September 2025 |
625.30 (5.79%) |
593.90 |
588.20 - 798.00 |
3.2014 times |
Fri 29 August 2025 |
591.10 (-2.15%) |
617.00 |
577.10 - 644.50 |
0.4483 times |
Thu 31 July 2025 |
604.10 (-10.6%) |
677.00 |
602.45 - 684.00 |
0.4263 times |
Mon 30 June 2025 |
675.75 (-1.17%) |
685.00 |
608.15 - 721.00 |
1.2524 times |
Fri 30 May 2025 |
683.75 (13.92%) |
599.00 |
587.10 - 693.00 |
1.3208 times |
Wed 30 April 2025 |
600.20 (-1.91%) |
599.05 |
545.50 - 634.00 |
0.4969 times |
Thu 27 March 2025 |
611.90 (9.83%) |
559.40 |
532.60 - 641.90 |
0.781 times |
Fri 28 February 2025 |
557.15 (-13.36%) |
629.95 |
555.00 - 647.45 |
0.4255 times |
Fri 31 January 2025 |
643.10 (-15.5%) |
751.00 |
607.40 - 766.60 |
1.1601 times |
Tue 31 December 2024 |
761.05 (-6.32%) |
812.00 |
665.25 - 815.30 |
1.2288 times |

DMA SMA EMA moving averages of Adani Total ATGL
DMA (daily moving average) of Adani Total ATGL
| DMA period | DMA value | | 5 day DMA | 621.86 | | 12 day DMA | 621.72 | | 20 day DMA | 626.02 | | 35 day DMA | 631.01 | | 50 day DMA | 624.71 | | 100 day DMA | 633.98 | | 150 day DMA | 632.92 | | 200 day DMA | 629.99 | EMA (exponential moving average) of Adani Total ATGL
| EMA period | EMA current | EMA prev | EMA prev2 | | 5 day EMA | 621.23 | 621.34 | 622.49 | | 12 day EMA | 623.64 | 624.12 | 625.04 | | 20 day EMA | 626.08 | 626.61 | 627.4 | | 35 day EMA | 623.16 | 623.29 | 623.54 | | 50 day EMA | 622.3 | 622.35 | 622.48 |
SMA (simple moving average) of Adani Total ATGL
| SMA period | SMA current | SMA prev | SMA prev2 | | 5 day SMA | 621.86 | 621.8 | 621.95 | | 12 day SMA | 621.72 | 622.28 | 623.13 | | 20 day SMA | 626.02 | 627.44 | 630.07 | | 35 day SMA | 631.01 | 630.14 | 629.48 | | 50 day SMA | 624.71 | 624.47 | 624.33 | | 100 day SMA | 633.98 | 634.59 | 635.19 | | 150 day SMA | 632.92 | 632.84 | 632.74 | | 200 day SMA | 629.99 | 630.52 | 631.1 |
|
|
