AspireInnovative ASPIRE_SM full analysis,charts,indicators,moving averages,SMA,DMA,EMA,ADX,MACD,RSIAspire Innovative ASPIRE_SM WideScreen charts, DMA,SMA,EMA technical analysis, forecast prediction, by indicators ADX,MACD,RSI,CCI NSE stock exchange
Daily price and charts and targets AspireInnovative Strong Daily Stock price targets for AspireInnovative ASPIRE_SM are 19.6 and 19.6 | Daily Target 1 | 19.6 | | Daily Target 2 | 19.6 | | Daily Target 3 | 19.6 | | Daily Target 4 | 19.6 | | Daily Target 5 | 19.6 |
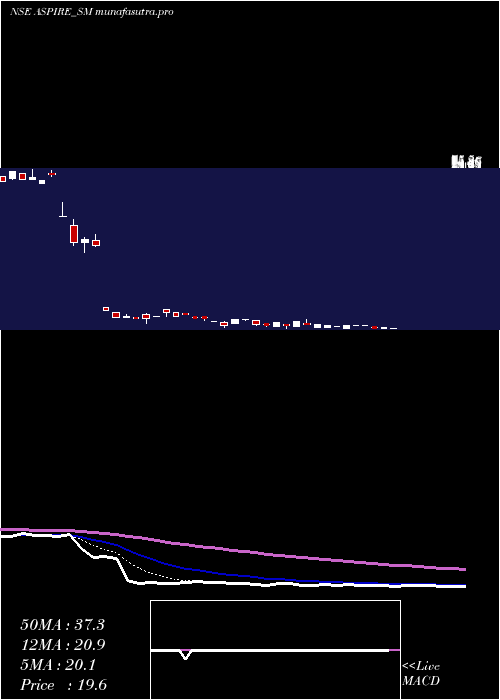
Daily price and volume Aspire Innovative
| Date |
Closing |
Open |
Range |
Volume |
Mon 27 October 2025 |
19.60 (-2.49%) |
19.60 |
19.60 - 19.60 |
0.2273 times |
Fri 24 October 2025 |
20.10 (0.5%) |
19.70 |
19.70 - 20.10 |
0.4545 times |
Thu 23 October 2025 |
20.00 (-3.38%) |
20.15 |
19.75 - 20.15 |
1.8182 times |
Tue 21 October 2025 |
20.70 (0%) |
20.70 |
20.70 - 20.70 |
0.2273 times |
Mon 20 October 2025 |
20.70 (0%) |
20.70 |
20.70 - 20.70 |
0.2273 times |
Fri 17 October 2025 |
20.70 (0.98%) |
19.80 |
19.80 - 20.70 |
0.4545 times |
Thu 16 October 2025 |
20.50 (-1.44%) |
20.50 |
20.50 - 20.50 |
0.4545 times |
Tue 14 October 2025 |
20.80 (-1.65%) |
20.15 |
20.10 - 20.80 |
1.8182 times |
Thu 09 October 2025 |
21.15 (0.24%) |
20.05 |
20.05 - 21.15 |
1.5909 times |
Wed 08 October 2025 |
21.10 (-4.95%) |
21.35 |
21.10 - 22.80 |
2.7273 times |
Tue 07 October 2025 |
22.20 (7.77%) |
20.25 |
20.25 - 22.20 |
1.5909 times |
Weekly price and charts AspireInnovative Strong weekly Stock price targets for AspireInnovative ASPIRE_SM are 19.6 and 19.6 | Weekly Target 1 | 19.6 | | Weekly Target 2 | 19.6 | | Weekly Target 3 | 19.6 | | Weekly Target 4 | 19.6 | | Weekly Target 5 | 19.6 |
Weekly price and volumes for Aspire Innovative
| Date |
Closing |
Open |
Range |
Volume |
Mon 27 October 2025 |
19.60 (-2.49%) |
19.60 |
19.60 - 19.60 |
0.0185 times |
Fri 24 October 2025 |
20.10 (-2.9%) |
20.70 |
19.70 - 20.70 |
0.2222 times |
Fri 17 October 2025 |
20.70 (-2.13%) |
20.15 |
19.80 - 20.80 |
0.2222 times |
Thu 09 October 2025 |
21.15 (-3.42%) |
21.10 |
19.75 - 22.80 |
0.6481 times |
Fri 03 October 2025 |
21.90 (-4.78%) |
22.50 |
20.25 - 22.50 |
0.4259 times |
Fri 26 September 2025 |
23.00 (-2.34%) |
23.55 |
20.10 - 23.55 |
1.1111 times |
Fri 19 September 2025 |
23.55 (1.73%) |
23.95 |
23.55 - 26.30 |
0.3148 times |
Fri 12 September 2025 |
23.15 (-52.51%) |
27.00 |
21.35 - 27.00 |
0.9444 times |
Tue 19 November 2024 |
48.75 (-2.5%) |
50.00 |
46.20 - 52.70 |
1 times |
Thu 14 November 2024 |
50.00 (-30.17%) |
74.00 |
49.00 - 75.00 |
5.0926 times |
Fri 08 November 2024 |
71.60 (-1.92%) |
73.00 |
70.75 - 75.50 |
0.4259 times |

Monthly price and charts AspireInnovative Strong monthly Stock price targets for AspireInnovative ASPIRE_SM are 18 and 21.2 | Monthly Target 1 | 17.47 | | Monthly Target 2 | 18.53 | | Monthly Target 3 | 20.666666666667 | | Monthly Target 4 | 21.73 | | Monthly Target 5 | 23.87 |
Monthly price and volumes Aspire Innovative
| Date |
Closing |
Open |
Range |
Volume |
Mon 27 October 2025 |
19.60 (-6.44%) |
20.50 |
19.60 - 22.80 |
0.1044 times |
Tue 30 September 2025 |
20.95 (-57.03%) |
27.00 |
20.10 - 27.00 |
0.2453 times |
Tue 19 November 2024 |
48.75 (-30.36%) |
68.05 |
46.20 - 75.50 |
0.5933 times |
Thu 31 October 2024 |
70.00 (-4.11%) |
75.00 |
61.00 - 83.00 |
0.4541 times |
Mon 30 September 2024 |
73.00 (-17.89%) |
86.75 |
70.00 - 88.65 |
0.7922 times |
Fri 30 August 2024 |
88.90 (-14.52%) |
104.05 |
84.10 - 104.05 |
0.5353 times |
Wed 31 July 2024 |
104.00 (1.07%) |
101.95 |
96.00 - 132.00 |
1.7551 times |
Fri 28 June 2024 |
102.90 (5.7%) |
107.00 |
85.00 - 123.50 |
1.1734 times |
Fri 31 May 2024 |
97.35 (8.71%) |
94.50 |
67.55 - 114.90 |
2.3218 times |
Tue 30 April 2024 |
89.55 (0%) |
85.00 |
80.00 - 115.70 |
2.0252 times |
Tue 28 October 2025 |
(0%) |
|
- |
0 times |

DMA SMA EMA moving averages of Aspire Innovative ASPIRE_SM
DMA (daily moving average) of Aspire Innovative ASPIRE_SM
| DMA period | DMA value | | 5 day DMA | 20.22 | | 12 day DMA | 20.68 | | 20 day DMA | 21.22 | | 35 day DMA | 27.08 | | 50 day DMA | 40.35 | | 100 day DMA | 61.28 | | 150 day DMA | 75.54 | | 200 day DMA | | EMA (exponential moving average) of Aspire Innovative ASPIRE_SM
| EMA period | EMA current | EMA prev | EMA prev2 | | 5 day EMA | 20.11 | 20.37 | 20.51 | | 12 day EMA | 20.93 | 21.17 | 21.37 | | 20 day EMA | 23.33 | 23.72 | 24.1 | | 35 day EMA | 32.34 | 33.09 | 33.86 | | 50 day EMA | 41.46 | 42.35 | 43.26 |
SMA (simple moving average) of Aspire Innovative ASPIRE_SM
| SMA period | SMA current | SMA prev | SMA prev2 | | 5 day SMA | 20.22 | 20.44 | 20.52 | | 12 day SMA | 20.68 | 20.87 | 20.94 | | 20 day SMA | 21.22 | 21.41 | 21.63 | | 35 day SMA | 27.08 | 28.57 | 30.07 | | 50 day SMA | 40.35 | 41.49 | 42.6 | | 100 day SMA | 61.28 | 62.03 | 62.74 | | 150 day SMA | 75.54 | 76.08 | 76.64 | | 200 day SMA |
|
|
