AspinwallCo ASPINWALL full analysis,charts,indicators,moving averages,SMA,DMA,EMA,ADX,MACD,RSIAspinwall Co ASPINWALL WideScreen charts, DMA,SMA,EMA technical analysis, forecast prediction, by indicators ADX,MACD,RSI,CCI NSE stock exchange
Daily price and charts and targets AspinwallCo Strong Daily Stock price targets for AspinwallCo ASPINWALL are 258.98 and 263.93 | Daily Target 1 | 255.37 | | Daily Target 2 | 257.63 | | Daily Target 3 | 260.31666666667 | | Daily Target 4 | 262.58 | | Daily Target 5 | 265.27 |
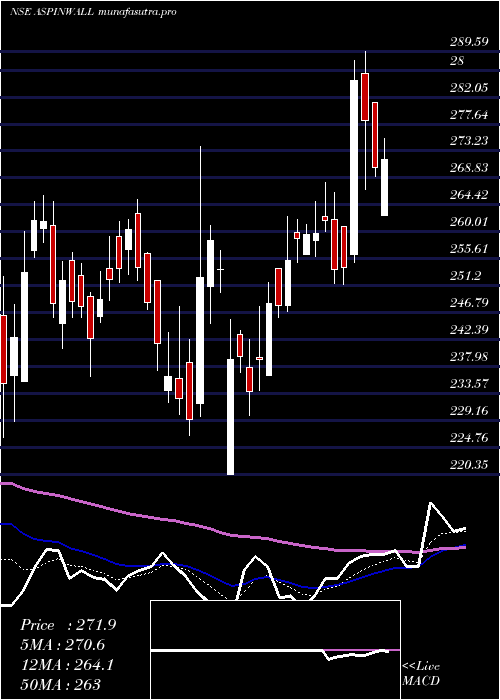
Daily price and volume Aspinwall Co
| Date |
Closing |
Open |
Range |
Volume |
Tue 28 October 2025 |
259.90 (-0.42%) |
258.05 |
258.05 - 263.00 |
1.5848 times |
Mon 27 October 2025 |
261.00 (-0.51%) |
262.10 |
259.25 - 262.35 |
0.4373 times |
Fri 24 October 2025 |
262.35 (-0.72%) |
264.30 |
262.25 - 267.00 |
0.3208 times |
Thu 23 October 2025 |
264.25 (0.69%) |
267.00 |
260.25 - 267.00 |
0.1085 times |
Tue 21 October 2025 |
262.45 (0.06%) |
262.35 |
258.10 - 267.60 |
0.4761 times |
Mon 20 October 2025 |
262.30 (0.36%) |
261.35 |
257.65 - 262.80 |
0.596 times |
Fri 17 October 2025 |
261.35 (0.06%) |
262.00 |
257.80 - 262.90 |
0.4282 times |
Thu 16 October 2025 |
261.20 (-0.99%) |
263.80 |
258.15 - 264.40 |
1.9297 times |
Wed 15 October 2025 |
263.80 (-1.22%) |
265.75 |
260.00 - 267.85 |
2.182 times |
Tue 14 October 2025 |
267.05 (0.77%) |
265.05 |
261.10 - 269.00 |
1.9365 times |
Mon 13 October 2025 |
265.00 (1.34%) |
267.90 |
261.55 - 269.00 |
1.1966 times |
Weekly price and charts AspinwallCo Strong weekly Stock price targets for AspinwallCo ASPINWALL are 256.5 and 261.45 | Weekly Target 1 | 255.37 | | Weekly Target 2 | 257.63 | | Weekly Target 3 | 260.31666666667 | | Weekly Target 4 | 262.58 | | Weekly Target 5 | 265.27 |
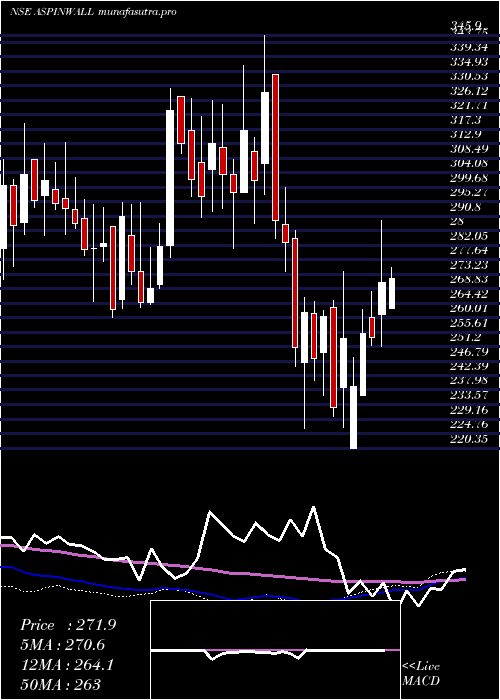
Weekly price and volumes for Aspinwall Co
| Date |
Closing |
Open |
Range |
Volume |
Tue 28 October 2025 |
259.90 (-0.93%) |
262.10 |
258.05 - 263.00 |
0.1751 times |
Fri 24 October 2025 |
262.35 (0.38%) |
261.35 |
257.65 - 267.60 |
0.13 times |
Fri 17 October 2025 |
261.35 (-0.06%) |
267.90 |
257.80 - 269.00 |
0.6645 times |
Fri 10 October 2025 |
261.50 (-1.41%) |
264.25 |
256.35 - 268.00 |
4.7037 times |
Fri 03 October 2025 |
265.25 (-1.3%) |
272.85 |
263.00 - 272.85 |
0.5504 times |
Fri 26 September 2025 |
268.75 (-1.45%) |
273.25 |
262.40 - 275.00 |
1.3 times |
Fri 19 September 2025 |
272.70 (1.89%) |
272.75 |
268.00 - 274.60 |
0.659 times |
Fri 12 September 2025 |
267.65 (-1.16%) |
269.95 |
266.25 - 277.80 |
0.8734 times |
Fri 05 September 2025 |
270.80 (1.79%) |
269.25 |
267.85 - 275.00 |
0.3545 times |
Fri 29 August 2025 |
266.05 (-2.15%) |
274.65 |
264.20 - 274.65 |
0.5894 times |
Fri 22 August 2025 |
271.90 (1.17%) |
269.35 |
268.35 - 276.00 |
0.7432 times |
Monthly price and charts AspinwallCo Strong monthly Stock price targets for AspinwallCo ASPINWALL are 251.8 and 264.45 | Monthly Target 1 | 249.1 | | Monthly Target 2 | 254.5 | | Monthly Target 3 | 261.75 | | Monthly Target 4 | 267.15 | | Monthly Target 5 | 274.4 |
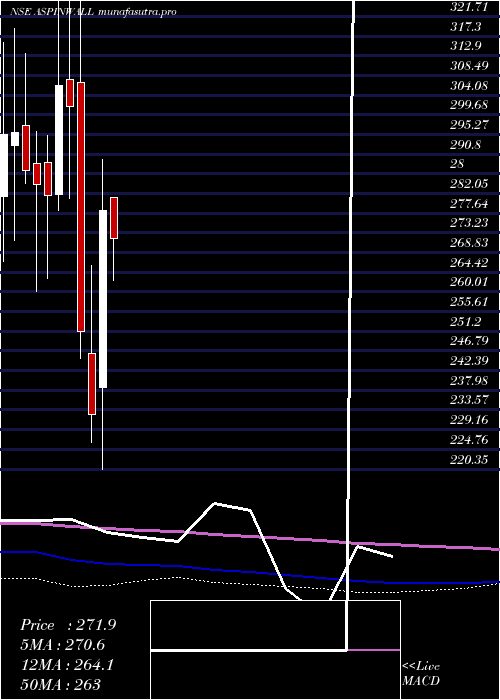
Monthly price and volumes Aspinwall Co
| Date |
Closing |
Open |
Range |
Volume |
Tue 28 October 2025 |
259.90 (-1.66%) |
263.00 |
256.35 - 269.00 |
0.2806 times |
Tue 30 September 2025 |
264.30 (-0.66%) |
269.25 |
262.40 - 277.80 |
0.1504 times |
Fri 29 August 2025 |
266.05 (-7.09%) |
285.85 |
262.30 - 298.00 |
0.5147 times |
Thu 31 July 2025 |
286.35 (-4.84%) |
297.50 |
281.05 - 315.00 |
0.381 times |
Mon 30 June 2025 |
300.90 (6.53%) |
281.55 |
275.00 - 310.00 |
0.8069 times |
Fri 30 May 2025 |
282.45 (1.55%) |
281.15 |
247.00 - 310.00 |
1.0848 times |
Wed 30 April 2025 |
278.15 (19.56%) |
238.67 |
220.35 - 289.59 |
1.3386 times |
Fri 28 March 2025 |
232.65 (-7.33%) |
246.25 |
226.25 - 266.00 |
0.9619 times |
Fri 28 February 2025 |
251.05 (-16.76%) |
306.95 |
245.20 - 345.90 |
1.8771 times |
Fri 31 January 2025 |
301.60 (-1.49%) |
307.65 |
281.00 - 336.50 |
2.604 times |
Tue 31 December 2024 |
306.15 (8.74%) |
281.80 |
278.20 - 329.50 |
3.2747 times |
DMA SMA EMA moving averages of Aspinwall Co ASPINWALL
DMA (daily moving average) of Aspinwall Co ASPINWALL
| DMA period | DMA value | | 5 day DMA | 261.99 | | 12 day DMA | 262.68 | | 20 day DMA | 263.47 | | 35 day DMA | 266.27 | | 50 day DMA | 267.41 | | 100 day DMA | 277.74 | | 150 day DMA | 273.59 | | 200 day DMA | 277.12 | EMA (exponential moving average) of Aspinwall Co ASPINWALL
| EMA period | EMA current | EMA prev | EMA prev2 | | 5 day EMA | 261.46 | 262.24 | 262.86 | | 12 day EMA | 262.63 | 263.13 | 263.52 | | 20 day EMA | 263.76 | 264.17 | 264.5 | | 35 day EMA | 265.26 | 265.58 | 265.85 | | 50 day EMA | 267.05 | 267.34 | 267.6 |
SMA (simple moving average) of Aspinwall Co ASPINWALL
| SMA period | SMA current | SMA prev | SMA prev2 | | 5 day SMA | 261.99 | 262.47 | 262.54 | | 12 day SMA | 262.68 | 262.78 | 263.37 | | 20 day SMA | 263.47 | 263.91 | 264.36 | | 35 day SMA | 266.27 | 266.58 | 266.83 | | 50 day SMA | 267.41 | 267.63 | 267.85 | | 100 day SMA | 277.74 | 277.98 | 278.2 | | 150 day SMA | 273.59 | 273.54 | 273.46 | | 200 day SMA | 277.12 | 277.31 | 277.56 |
|
|
