AslIndustries ASLIND_ST full analysis,charts,indicators,moving averages,SMA,DMA,EMA,ADX,MACD,RSIAsl Industries ASLIND_ST WideScreen charts, DMA,SMA,EMA technical analysis, forecast prediction, by indicators ADX,MACD,RSI,CCI NSE stock exchange
Daily price and charts and targets AslIndustries Strong Daily Stock price targets for AslIndustries ASLIND_ST are 80.25 and 80.25 | Daily Target 1 | 80.25 | | Daily Target 2 | 80.25 | | Daily Target 3 | 80.25 | | Daily Target 4 | 80.25 | | Daily Target 5 | 80.25 |
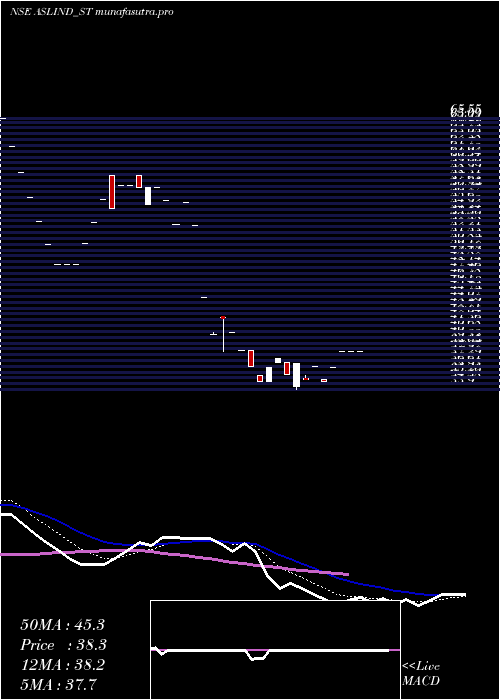
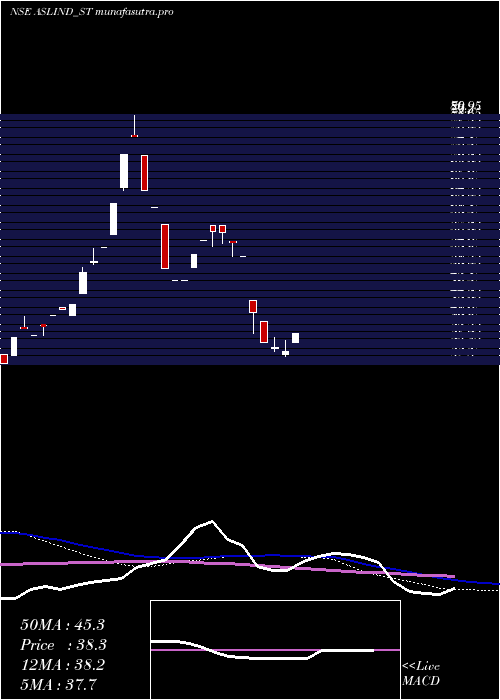
Daily price and volume Asl Industries
| Date |
Closing |
Open |
Range |
Volume |
Tue 28 October 2025 |
80.25 (1.97%) |
80.25 |
80.25 - 80.25 |
0.6667 times |
Mon 27 October 2025 |
78.70 (1.94%) |
78.70 |
78.70 - 78.70 |
0.6667 times |
Fri 24 October 2025 |
77.20 (1.98%) |
77.20 |
77.20 - 77.20 |
0.6667 times |
Thu 23 October 2025 |
75.70 (1.54%) |
75.70 |
75.70 - 75.70 |
1.3333 times |
Tue 21 October 2025 |
74.55 (1.98%) |
74.55 |
74.55 - 74.55 |
0.6667 times |
Fri 17 October 2025 |
73.10 (1.95%) |
73.10 |
73.10 - 73.10 |
0.6667 times |
Wed 15 October 2025 |
71.70 (1.99%) |
71.70 |
71.70 - 71.70 |
0.6667 times |
Mon 13 October 2025 |
70.30 (1.96%) |
70.25 |
70.25 - 70.30 |
1.3333 times |
Fri 10 October 2025 |
68.95 (2%) |
68.95 |
68.95 - 68.95 |
2 times |
Thu 09 October 2025 |
67.60 (1.96%) |
67.60 |
67.60 - 67.60 |
1.3333 times |
Fri 03 October 2025 |
66.30 (2%) |
66.30 |
66.00 - 66.30 |
4 times |
Weekly price and charts AslIndustries Strong weekly Stock price targets for AslIndustries ASLIND_ST are 79.48 and 81.03 | Weekly Target 1 | 78.18 | | Weekly Target 2 | 79.22 | | Weekly Target 3 | 79.733333333333 | | Weekly Target 4 | 80.77 | | Weekly Target 5 | 81.28 |
Weekly price and volumes for Asl Industries
| Date |
Closing |
Open |
Range |
Volume |
Tue 28 October 2025 |
80.25 (3.95%) |
78.70 |
78.70 - 80.25 |
0.25 times |
Fri 24 October 2025 |
77.20 (5.61%) |
74.55 |
74.55 - 77.20 |
0.5 times |
Fri 17 October 2025 |
73.10 (6.02%) |
70.25 |
70.25 - 73.10 |
0.5 times |
Fri 10 October 2025 |
68.95 (4%) |
67.60 |
67.60 - 68.95 |
0.625 times |
Fri 03 October 2025 |
66.30 (6.08%) |
63.75 |
63.75 - 66.30 |
1 times |
Fri 26 September 2025 |
62.50 (8.13%) |
58.95 |
58.95 - 62.50 |
1.125 times |
Thu 18 September 2025 |
57.80 (21.05%) |
50.10 |
47.55 - 57.80 |
3 times |
Fri 12 September 2025 |
47.75 (-4.4%) |
48.00 |
45.50 - 48.00 |
1 times |
Fri 05 September 2025 |
49.95 (1.94%) |
48.05 |
48.05 - 49.95 |
0.5 times |
Fri 29 August 2025 |
49.00 (-0.41%) |
50.05 |
49.00 - 51.15 |
1.5 times |
Thu 21 August 2025 |
49.20 (3.91%) |
48.25 |
48.25 - 49.20 |
0.625 times |
Monthly price and charts AslIndustries Strong monthly Stock price targets for AslIndustries ASLIND_ST are 72.63 and 87.88 | Monthly Target 1 | 59.92 | | Monthly Target 2 | 70.08 | | Monthly Target 3 | 75.166666666667 | | Monthly Target 4 | 85.33 | | Monthly Target 5 | 90.42 |
Monthly price and volumes Asl Industries
| Date |
Closing |
Open |
Range |
Volume |
Tue 28 October 2025 |
80.25 (25.88%) |
65.00 |
65.00 - 80.25 |
0.3308 times |
Mon 29 September 2025 |
63.75 (30.1%) |
48.05 |
45.50 - 63.75 |
0.6917 times |
Fri 29 August 2025 |
49.00 (-7.55%) |
53.00 |
47.35 - 53.00 |
0.5714 times |
Thu 31 July 2025 |
53.00 (26.34%) |
41.15 |
40.05 - 53.25 |
1.3835 times |
Fri 27 June 2025 |
41.95 (-11.31%) |
46.35 |
41.95 - 46.35 |
0.1955 times |
Fri 30 May 2025 |
47.30 (22.86%) |
38.50 |
33.90 - 47.30 |
1.3534 times |
Wed 30 April 2025 |
38.50 (-27.36%) |
44.60 |
38.30 - 44.60 |
0.5564 times |
Wed 19 June 2024 |
53.00 (-5.19%) |
53.10 |
53.00 - 55.75 |
4.5414 times |
Tue 14 May 2024 |
55.90 (1.64%) |
57.75 |
55.50 - 58.90 |
0.1504 times |
Mon 29 April 2024 |
55.00 (13.4%) |
48.50 |
48.50 - 58.85 |
0.2256 times |
Wed 27 March 2024 |
48.50 (-29.71%) |
65.55 |
48.50 - 65.55 |
0.5113 times |

DMA SMA EMA moving averages of Asl Industries ASLIND_ST
DMA (daily moving average) of Asl Industries ASLIND_ST
| DMA period | DMA value | | 5 day DMA | 77.28 | | 12 day DMA | 72.45 | | 20 day DMA | 67.45 | | 35 day DMA | 59.57 | | 50 day DMA | 56.29 | | 100 day DMA | 50.51 | | 150 day DMA | | | 200 day DMA | | EMA (exponential moving average) of Asl Industries ASLIND_ST
| EMA period | EMA current | EMA prev | EMA prev2 | | 5 day EMA | 77.33 | 75.87 | 74.46 | | 12 day EMA | 72.71 | 71.34 | 70 | | 20 day EMA | 68.39 | 67.14 | 65.92 | | 35 day EMA | 62.96 | 61.94 | 60.95 | | 50 day EMA | 57.43 | 56.5 | 55.59 |
SMA (simple moving average) of Asl Industries ASLIND_ST
| SMA period | SMA current | SMA prev | SMA prev2 | | 5 day SMA | 77.28 | 75.85 | 74.45 | | 12 day SMA | 72.45 | 71.07 | 69.72 | | 20 day SMA | 67.45 | 66.06 | 64.62 | | 35 day SMA | 59.57 | 58.63 | 57.76 | | 50 day SMA | 56.29 | 55.66 | 55.01 | | 100 day SMA | 50.51 | 50.19 | 49.89 | | 150 day SMA | | 200 day SMA |
|
|
