AshianaHousing ASHIANA full analysis,charts,indicators,moving averages,SMA,DMA,EMA,ADX,MACD,RSIAshiana Housing ASHIANA WideScreen charts, DMA,SMA,EMA technical analysis, forecast prediction, by indicators ADX,MACD,RSI,CCI NSE stock exchange
operates under Realty sector
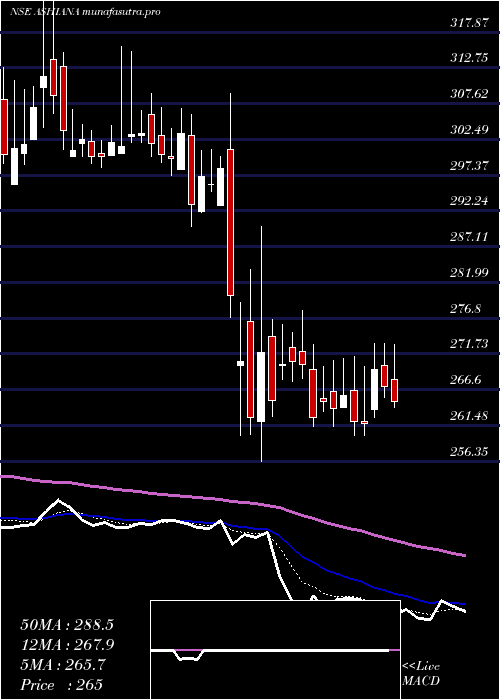
Daily price and charts and targets AshianaHousing Strong Daily Stock price targets for AshianaHousing ASHIANA are 280.38 and 288.83 | Daily Target 1 | 273.47 | | Daily Target 2 | 278.83 | | Daily Target 3 | 281.91666666667 | | Daily Target 4 | 287.28 | | Daily Target 5 | 290.37 |
Daily price and volume Ashiana Housing
| Date |
Closing |
Open |
Range |
Volume |
Wed 29 October 2025 |
284.20 (2.64%) |
276.90 |
276.55 - 285.00 |
1.0315 times |
Tue 28 October 2025 |
276.90 (-1.7%) |
281.10 |
275.85 - 284.25 |
1.1591 times |
Mon 27 October 2025 |
281.70 (-0.05%) |
281.90 |
278.35 - 286.70 |
0.9229 times |
Fri 24 October 2025 |
281.85 (-1.9%) |
290.00 |
280.35 - 290.20 |
0.8152 times |
Thu 23 October 2025 |
287.30 (-2.01%) |
295.00 |
286.00 - 301.95 |
1.2173 times |
Tue 21 October 2025 |
293.20 (0.77%) |
290.95 |
290.95 - 294.95 |
0.231 times |
Mon 20 October 2025 |
290.95 (-2.79%) |
302.05 |
288.10 - 302.90 |
1.4711 times |
Fri 17 October 2025 |
299.30 (1.77%) |
293.90 |
290.00 - 301.70 |
0.5048 times |
Thu 16 October 2025 |
294.10 (1.59%) |
290.65 |
285.65 - 297.70 |
0.5474 times |
Wed 15 October 2025 |
289.50 (-0.17%) |
287.00 |
281.35 - 298.80 |
2.0997 times |
Tue 14 October 2025 |
290.00 (-1.64%) |
297.00 |
289.35 - 297.00 |
0.6246 times |
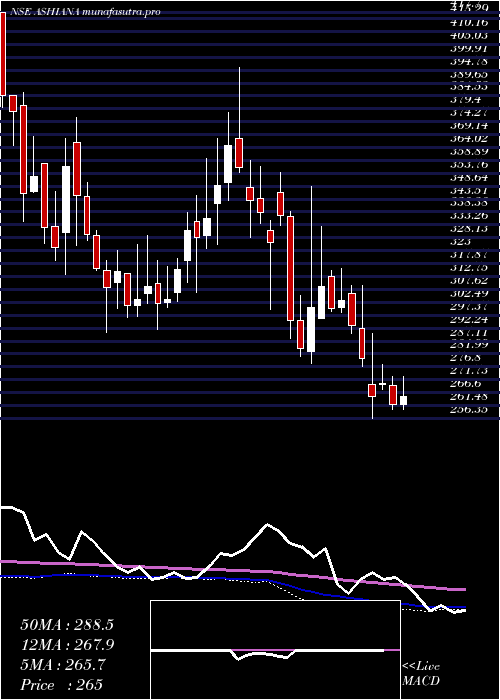
Weekly price and charts AshianaHousing Strong weekly Stock price targets for AshianaHousing ASHIANA are 280.03 and 290.88 | Weekly Target 1 | 271.4 | | Weekly Target 2 | 277.8 | | Weekly Target 3 | 282.25 | | Weekly Target 4 | 288.65 | | Weekly Target 5 | 293.1 |
Weekly price and volumes for Ashiana Housing
| Date |
Closing |
Open |
Range |
Volume |
Wed 29 October 2025 |
284.20 (0.83%) |
281.90 |
275.85 - 286.70 |
0.6553 times |
Fri 24 October 2025 |
281.85 (-5.83%) |
302.05 |
280.35 - 302.90 |
0.786 times |
Fri 17 October 2025 |
299.30 (0.62%) |
298.00 |
281.35 - 301.70 |
0.8791 times |
Fri 10 October 2025 |
297.45 (-1.59%) |
302.30 |
292.80 - 305.20 |
0.5293 times |
Fri 03 October 2025 |
302.25 (2.27%) |
295.55 |
288.05 - 307.70 |
0.6091 times |
Fri 26 September 2025 |
295.55 (-4.75%) |
308.15 |
292.00 - 313.15 |
0.9197 times |
Fri 19 September 2025 |
310.30 (-1.02%) |
314.90 |
304.00 - 316.00 |
1.139 times |
Fri 12 September 2025 |
313.50 (-0.02%) |
314.95 |
308.60 - 316.20 |
0.5152 times |
Fri 05 September 2025 |
313.55 (0.84%) |
308.20 |
306.60 - 318.00 |
1.0323 times |
Fri 29 August 2025 |
310.95 (-0.69%) |
313.10 |
307.65 - 336.00 |
2.935 times |
Fri 22 August 2025 |
313.10 (-0.9%) |
318.20 |
301.00 - 321.00 |
1.3183 times |
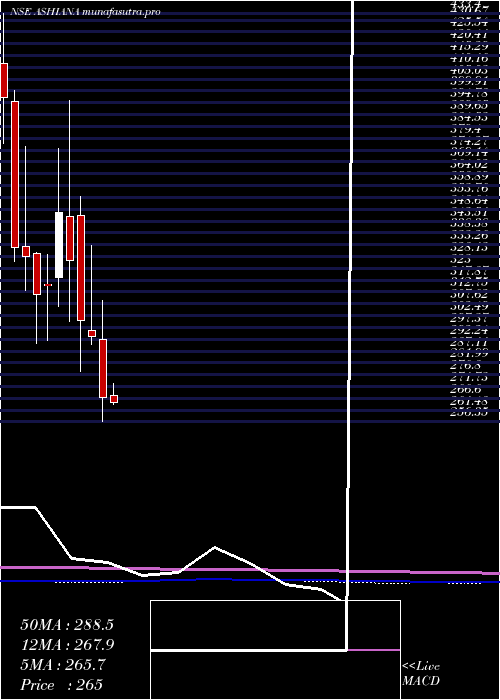
Monthly price and charts AshianaHousing Strong monthly Stock price targets for AshianaHousing ASHIANA are 264.1 and 295.95 | Monthly Target 1 | 257.4 | | Monthly Target 2 | 270.8 | | Monthly Target 3 | 289.25 | | Monthly Target 4 | 302.65 | | Monthly Target 5 | 321.1 |
Monthly price and volumes Ashiana Housing
| Date |
Closing |
Open |
Range |
Volume |
Wed 29 October 2025 |
284.20 (-5.06%) |
299.80 |
275.85 - 307.70 |
0.2941 times |
Tue 30 September 2025 |
299.35 (-3.73%) |
308.20 |
288.05 - 318.00 |
0.3742 times |
Fri 29 August 2025 |
310.95 (-1.72%) |
316.00 |
301.00 - 336.00 |
0.5728 times |
Thu 31 July 2025 |
316.40 (-8.46%) |
347.90 |
309.45 - 355.00 |
0.5199 times |
Mon 30 June 2025 |
345.65 (7.55%) |
307.55 |
307.15 - 376.15 |
0.9357 times |
Fri 30 May 2025 |
321.40 (20.35%) |
268.00 |
247.80 - 325.00 |
1.0097 times |
Wed 30 April 2025 |
267.05 (-8.92%) |
292.15 |
256.35 - 309.00 |
1.1571 times |
Fri 28 March 2025 |
293.20 (-2.38%) |
296.00 |
290.05 - 332.75 |
0.8933 times |
Fri 28 February 2025 |
300.35 (-7.92%) |
346.00 |
278.10 - 353.95 |
1.197 times |
Fri 31 January 2025 |
326.20 (-6.08%) |
345.55 |
299.75 - 395.70 |
3.0463 times |
Tue 31 December 2024 |
347.30 (10.01%) |
319.00 |
306.60 - 375.00 |
1.6676 times |
DMA SMA EMA moving averages of Ashiana Housing ASHIANA
DMA (daily moving average) of Ashiana Housing ASHIANA
| DMA period | DMA value | | 5 day DMA | 282.39 | | 12 day DMA | 288.65 | | 20 day DMA | 292.87 | | 35 day DMA | 299.01 | | 50 day DMA | 302.9 | | 100 day DMA | 318.19 | | 150 day DMA | 306.85 | | 200 day DMA | 310.24 | EMA (exponential moving average) of Ashiana Housing ASHIANA
| EMA period | EMA current | EMA prev | EMA prev2 | | 5 day EMA | 283.42 | 283.03 | 286.1 | | 12 day EMA | 287.83 | 288.49 | 290.6 | | 20 day EMA | 291.57 | 292.34 | 293.97 | | 35 day EMA | 296.83 | 297.57 | 298.79 | | 50 day EMA | 301.54 | 302.25 | 303.28 |
SMA (simple moving average) of Ashiana Housing ASHIANA
| SMA period | SMA current | SMA prev | SMA prev2 | | 5 day SMA | 282.39 | 284.19 | 287 | | 12 day SMA | 288.65 | 289.76 | 291.47 | | 20 day SMA | 292.87 | 293.28 | 294.22 | | 35 day SMA | 299.01 | 299.83 | 300.88 | | 50 day SMA | 302.9 | 303.53 | 304.19 | | 100 day SMA | 318.19 | 318.6 | 319.03 | | 150 day SMA | 306.85 | 306.98 | 307.14 | | 200 day SMA | 310.24 | 310.63 | 311.06 |
|
|
