Arvind ARVIND full analysis,charts,indicators,moving averages,SMA,DMA,EMA,ADX,MACD,RSIArvind ARVIND WideScreen charts, DMA,SMA,EMA technical analysis, forecast prediction, by indicators ADX,MACD,RSI,CCI NSE stock exchange
operates under Textiles sector
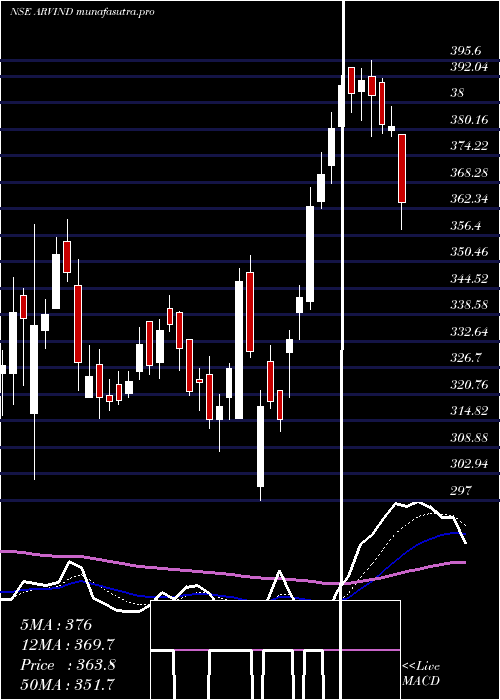
Daily price and charts and targets Arvind Strong Daily Stock price targets for Arvind ARVIND are 319.03 and 324.18 | Daily Target 1 | 317.97 | | Daily Target 2 | 320.08 | | Daily Target 3 | 323.11666666667 | | Daily Target 4 | 325.23 | | Daily Target 5 | 328.27 |
Daily price and volume Arvind
| Date |
Closing |
Open |
Range |
Volume |
Tue 28 October 2025 |
322.20 (-1.21%) |
326.15 |
321.00 - 326.15 |
0.3308 times |
Mon 27 October 2025 |
326.15 (0.91%) |
323.20 |
316.35 - 327.60 |
0.6175 times |
Fri 24 October 2025 |
323.20 (0.42%) |
320.00 |
315.35 - 325.50 |
0.9411 times |
Thu 23 October 2025 |
321.85 (4.85%) |
314.05 |
312.85 - 333.00 |
3.4033 times |
Tue 21 October 2025 |
306.95 (-0.15%) |
307.40 |
305.55 - 309.25 |
0.0661 times |
Mon 20 October 2025 |
307.40 (-0.03%) |
308.00 |
302.10 - 308.00 |
0.3281 times |
Fri 17 October 2025 |
307.50 (-0.37%) |
308.65 |
301.15 - 309.70 |
0.5005 times |
Thu 16 October 2025 |
308.65 (3.87%) |
299.55 |
295.00 - 311.00 |
1.0914 times |
Wed 15 October 2025 |
297.15 (3.81%) |
287.00 |
284.50 - 301.00 |
1.0012 times |
Tue 14 October 2025 |
286.25 (0.51%) |
287.10 |
281.05 - 288.70 |
1.72 times |
Mon 13 October 2025 |
284.80 (1.86%) |
280.20 |
277.90 - 292.90 |
1.4255 times |
Weekly price and charts Arvind Strong weekly Stock price targets for Arvind ARVIND are 313.65 and 324.9 | Weekly Target 1 | 310.8 | | Weekly Target 2 | 316.5 | | Weekly Target 3 | 322.05 | | Weekly Target 4 | 327.75 | | Weekly Target 5 | 333.3 |
Weekly price and volumes for Arvind
| Date |
Closing |
Open |
Range |
Volume |
Tue 28 October 2025 |
322.20 (-0.31%) |
323.20 |
316.35 - 327.60 |
0.2684 times |
Fri 24 October 2025 |
323.20 (5.11%) |
308.00 |
302.10 - 333.00 |
1.3414 times |
Fri 17 October 2025 |
307.50 (9.98%) |
280.20 |
277.90 - 311.00 |
1.6245 times |
Fri 10 October 2025 |
279.60 (-6.91%) |
300.35 |
278.90 - 300.70 |
0.8833 times |
Fri 03 October 2025 |
300.35 (-1.89%) |
306.65 |
296.10 - 308.80 |
0.6379 times |
Fri 26 September 2025 |
306.15 (-4.18%) |
319.45 |
305.00 - 323.95 |
0.6489 times |
Fri 19 September 2025 |
319.50 (-2.23%) |
326.80 |
316.65 - 339.60 |
1.0444 times |
Fri 12 September 2025 |
326.80 (13.08%) |
288.95 |
287.40 - 340.60 |
1.8539 times |
Fri 05 September 2025 |
289.00 (2.9%) |
283.65 |
278.95 - 296.00 |
0.9197 times |
Fri 29 August 2025 |
280.85 (-4.49%) |
296.00 |
274.80 - 296.65 |
0.7776 times |
Fri 22 August 2025 |
294.05 (2.44%) |
291.20 |
290.40 - 310.90 |
0.7843 times |
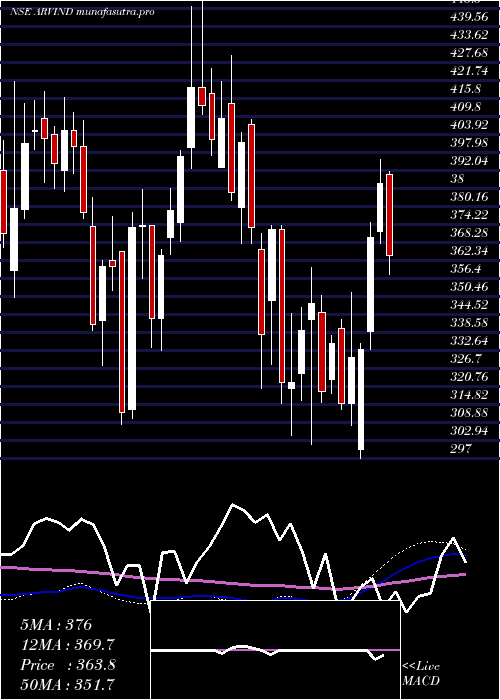
Monthly price and charts Arvind Strong monthly Stock price targets for Arvind ARVIND are 300.05 and 355.15 | Monthly Target 1 | 255.93 | | Monthly Target 2 | 289.07 | | Monthly Target 3 | 311.03333333333 | | Monthly Target 4 | 344.17 | | Monthly Target 5 | 366.13 |
Monthly price and volumes Arvind
| Date |
Closing |
Open |
Range |
Volume |
Tue 28 October 2025 |
322.20 (6.04%) |
302.35 |
277.90 - 333.00 |
0.7625 times |
Tue 30 September 2025 |
303.85 (8.19%) |
283.65 |
278.95 - 340.60 |
0.774 times |
Fri 29 August 2025 |
280.85 (-11.14%) |
316.05 |
274.80 - 320.40 |
0.665 times |
Thu 31 July 2025 |
316.05 (-10.42%) |
352.80 |
314.40 - 356.80 |
0.9001 times |
Mon 30 June 2025 |
352.80 (-1.42%) |
354.25 |
331.05 - 370.50 |
0.7589 times |
Fri 30 May 2025 |
357.90 (-1.62%) |
362.10 |
350.50 - 404.00 |
1.4518 times |
Wed 30 April 2025 |
363.80 (15.44%) |
315.00 |
297.00 - 395.60 |
0.9061 times |
Fri 28 March 2025 |
315.15 (-7.08%) |
343.00 |
301.55 - 360.00 |
1.2975 times |
Fri 28 February 2025 |
339.15 (0.36%) |
349.05 |
304.65 - 374.00 |
1.1036 times |
Fri 31 January 2025 |
337.95 (-17.65%) |
411.95 |
320.00 - 430.00 |
1.3805 times |
Tue 31 December 2024 |
410.40 (8.37%) |
374.95 |
368.55 - 450.00 |
1.8691 times |

DMA SMA EMA moving averages of Arvind ARVIND
DMA (daily moving average) of Arvind ARVIND
| DMA period | DMA value | | 5 day DMA | 320.07 | | 12 day DMA | 305.98 | | 20 day DMA | 302.05 | | 35 day DMA | 308.93 | | 50 day DMA | 303.75 | | 100 day DMA | 321.01 | | 150 day DMA | 333.59 | | 200 day DMA | 338.08 | EMA (exponential moving average) of Arvind ARVIND
| EMA period | EMA current | EMA prev | EMA prev2 | | 5 day EMA | 319.59 | 318.29 | 314.36 | | 12 day EMA | 311.69 | 309.78 | 306.81 | | 20 day EMA | 308.37 | 306.92 | 304.9 | | 35 day EMA | 304.7 | 303.67 | 302.35 | | 50 day EMA | 304.8 | 304.09 | 303.19 |
SMA (simple moving average) of Arvind ARVIND
| SMA period | SMA current | SMA prev | SMA prev2 | | 5 day SMA | 320.07 | 317.11 | 313.38 | | 12 day SMA | 305.98 | 302.99 | 299.8 | | 20 day SMA | 302.05 | 301.25 | 300.67 | | 35 day SMA | 308.93 | 307.99 | 307.08 | | 50 day SMA | 303.75 | 303.14 | 302.47 | | 100 day SMA | 321.01 | 321.32 | 321.55 | | 150 day SMA | 333.59 | 333.65 | 333.64 | | 200 day SMA | 338.08 | 338.45 | 338.87 |
|
|
