ArtemisMed ARTEMISMED full analysis,charts,indicators,moving averages,SMA,DMA,EMA,ADX,MACD,RSIArtemis Med ARTEMISMED WideScreen charts, DMA,SMA,EMA technical analysis, forecast prediction, by indicators ADX,MACD,RSI,CCI NSE stock exchange
Daily price and charts and targets ArtemisMed Strong Daily Stock price targets for ArtemisMed ARTEMISMED are 242.73 and 246.11 | Daily Target 1 | 241.69 | | Daily Target 2 | 243.76 | | Daily Target 3 | 245.07333333333 | | Daily Target 4 | 247.14 | | Daily Target 5 | 248.45 |
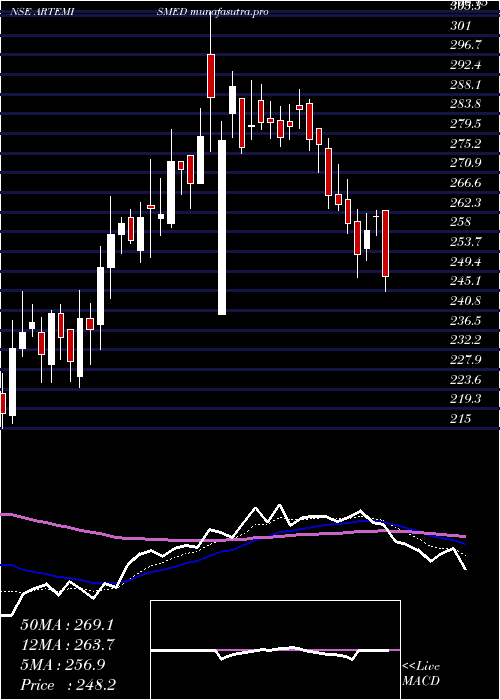
Daily price and volume Artemis Med
| Date |
Closing |
Open |
Range |
Volume |
Wed 29 October 2025 |
245.82 (0.47%) |
245.90 |
243.01 - 246.39 |
0.4169 times |
Tue 28 October 2025 |
244.66 (-1.18%) |
247.59 |
244.00 - 248.75 |
0.5664 times |
Mon 27 October 2025 |
247.59 (1.14%) |
244.80 |
243.87 - 249.07 |
1.3797 times |
Fri 24 October 2025 |
244.80 (0.33%) |
244.00 |
240.96 - 245.84 |
0.8251 times |
Thu 23 October 2025 |
244.00 (0.66%) |
243.70 |
239.00 - 245.90 |
1.0821 times |
Tue 21 October 2025 |
242.39 (0.03%) |
245.20 |
239.94 - 246.31 |
0.3438 times |
Mon 20 October 2025 |
242.31 (-0.7%) |
245.99 |
239.01 - 248.16 |
1.8088 times |
Fri 17 October 2025 |
244.01 (1.68%) |
239.90 |
238.32 - 246.00 |
1.438 times |
Thu 16 October 2025 |
239.99 (1.67%) |
236.04 |
236.04 - 248.56 |
1.6858 times |
Wed 15 October 2025 |
236.04 (0.88%) |
234.00 |
233.21 - 239.00 |
0.4534 times |
Tue 14 October 2025 |
233.97 (0.15%) |
233.60 |
232.20 - 237.98 |
1.0605 times |
Weekly price and charts ArtemisMed Strong weekly Stock price targets for ArtemisMed ARTEMISMED are 244.42 and 250.48 | Weekly Target 1 | 239.91 | | Weekly Target 2 | 242.86 | | Weekly Target 3 | 245.96666666667 | | Weekly Target 4 | 248.92 | | Weekly Target 5 | 252.03 |
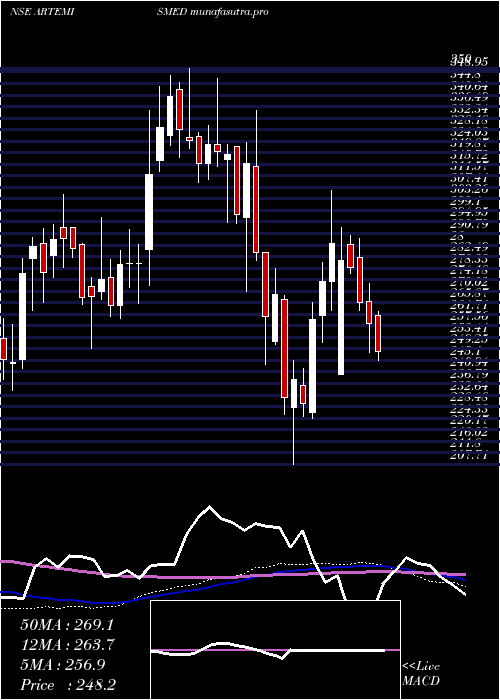
Weekly price and volumes for Artemis Med
| Date |
Closing |
Open |
Range |
Volume |
Wed 29 October 2025 |
245.82 (0.42%) |
244.80 |
243.01 - 249.07 |
0.341 times |
Fri 24 October 2025 |
244.80 (0.32%) |
245.99 |
239.00 - 248.16 |
0.5858 times |
Fri 17 October 2025 |
244.01 (1.77%) |
238.00 |
222.05 - 248.56 |
1.1302 times |
Fri 10 October 2025 |
239.77 (2.16%) |
234.69 |
232.30 - 251.00 |
1.7699 times |
Fri 03 October 2025 |
234.69 (1.15%) |
232.20 |
227.62 - 238.40 |
0.3342 times |
Fri 26 September 2025 |
232.02 (-2.77%) |
239.00 |
231.01 - 249.75 |
1.1277 times |
Fri 19 September 2025 |
238.63 (-0.22%) |
239.00 |
237.67 - 251.77 |
1.4608 times |
Fri 12 September 2025 |
239.15 (5.15%) |
228.57 |
226.01 - 244.80 |
1.4196 times |
Fri 05 September 2025 |
227.44 (3.86%) |
219.10 |
219.10 - 230.53 |
1.0795 times |
Fri 29 August 2025 |
218.98 (-8%) |
238.31 |
217.83 - 240.80 |
0.7513 times |
Fri 22 August 2025 |
238.02 (-0.97%) |
241.00 |
236.16 - 244.24 |
0.4896 times |
Monthly price and charts ArtemisMed Strong monthly Stock price targets for ArtemisMed ARTEMISMED are 233.94 and 262.89 | Monthly Target 1 | 210.67 | | Monthly Target 2 | 228.25 | | Monthly Target 3 | 239.62333333333 | | Monthly Target 4 | 257.2 | | Monthly Target 5 | 268.57 |
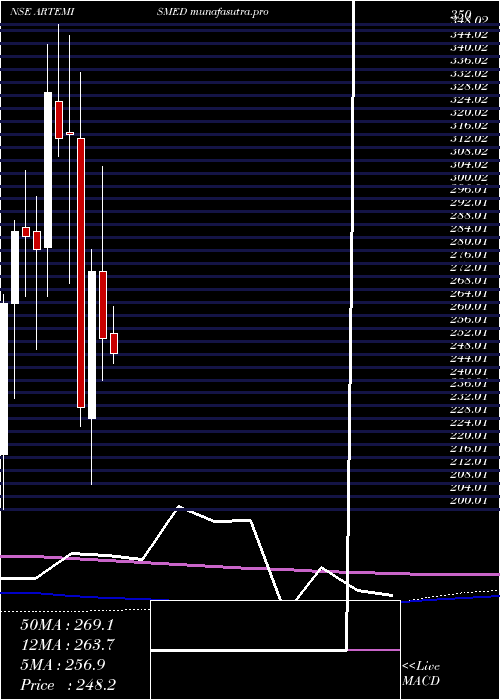
Monthly price and volumes Artemis Med
| Date |
Closing |
Open |
Range |
Volume |
Wed 29 October 2025 |
245.82 (4.97%) |
234.16 |
222.05 - 251.00 |
1.1431 times |
Tue 30 September 2025 |
234.18 (6.94%) |
219.10 |
219.10 - 251.77 |
1.5271 times |
Fri 29 August 2025 |
218.98 (-8.4%) |
239.05 |
217.83 - 256.60 |
0.723 times |
Thu 31 July 2025 |
239.05 (-6.07%) |
254.55 |
226.00 - 265.25 |
0.7528 times |
Mon 30 June 2025 |
254.50 (-8.93%) |
279.00 |
242.00 - 280.80 |
0.6039 times |
Fri 30 May 2025 |
279.45 (10.48%) |
254.30 |
223.30 - 290.00 |
1.2284 times |
Wed 30 April 2025 |
252.95 (-7.5%) |
273.45 |
240.00 - 306.15 |
0.7624 times |
Fri 28 March 2025 |
273.46 (18.05%) |
228.20 |
207.71 - 280.26 |
1.0088 times |
Fri 28 February 2025 |
231.65 (-26.69%) |
314.80 |
225.65 - 335.00 |
0.9827 times |
Fri 31 January 2025 |
316.00 (0.38%) |
316.45 |
270.00 - 346.70 |
1.2678 times |
Tue 31 December 2024 |
314.80 (-4.26%) |
326.00 |
309.00 - 350.00 |
1.2542 times |
DMA SMA EMA moving averages of Artemis Med ARTEMISMED
DMA (daily moving average) of Artemis Med ARTEMISMED
| DMA period | DMA value | | 5 day DMA | 245.37 | | 12 day DMA | 241.6 | | 20 day DMA | 239.76 | | 35 day DMA | 239.73 | | 50 day DMA | 236.98 | | 100 day DMA | 243.12 | | 150 day DMA | 250.5 | | 200 day DMA | 257.04 | EMA (exponential moving average) of Artemis Med ARTEMISMED
| EMA period | EMA current | EMA prev | EMA prev2 | | 5 day EMA | 244.97 | 244.55 | 244.5 | | 12 day EMA | 242.77 | 242.22 | 241.78 | | 20 day EMA | 241.29 | 240.81 | 240.4 | | 35 day EMA | 239.36 | 238.98 | 238.65 | | 50 day EMA | 238.13 | 237.82 | 237.54 |
SMA (simple moving average) of Artemis Med ARTEMISMED
| SMA period | SMA current | SMA prev | SMA prev2 | | 5 day SMA | 245.37 | 244.69 | 244.22 | | 12 day SMA | 241.6 | 241.1 | 240.22 | | 20 day SMA | 239.76 | 239.02 | 238.39 | | 35 day SMA | 239.73 | 239.43 | 238.93 | | 50 day SMA | 236.98 | 236.87 | 236.81 | | 100 day SMA | 243.12 | 243.35 | 243.63 | | 150 day SMA | 250.5 | 250.57 | 250.61 | | 200 day SMA | 257.04 | 257.51 | 257.89 |
|
|
