ArmanFinancial ARMANFIN full analysis,charts,indicators,moving averages,SMA,DMA,EMA,ADX,MACD,RSIArman Financial ARMANFIN WideScreen charts, DMA,SMA,EMA technical analysis, forecast prediction, by indicators ADX,MACD,RSI,CCI NSE stock exchange
operates under Finance (including NBFCs) sector
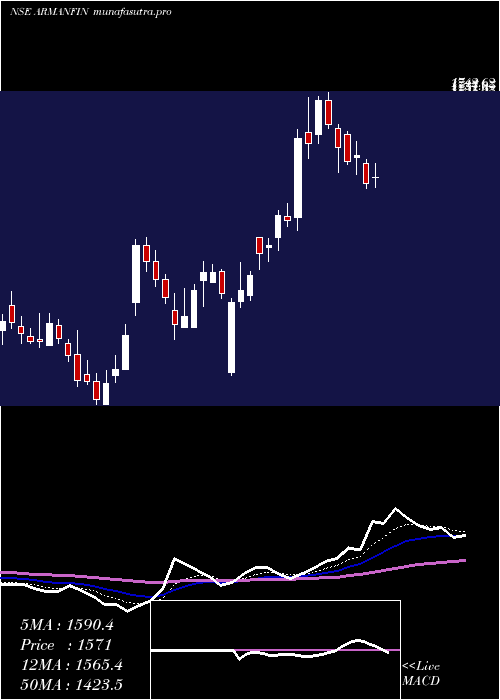
Daily price and charts and targets ArmanFinancial Strong Daily Stock price targets for ArmanFinancial ARMANFIN are 1617.55 and 1690.45 | Daily Target 1 | 1602.77 | | Daily Target 2 | 1632.33 | | Daily Target 3 | 1675.6666666667 | | Daily Target 4 | 1705.23 | | Daily Target 5 | 1748.57 |
Daily price and volume Arman Financial
| Date |
Closing |
Open |
Range |
Volume |
Tue 28 October 2025 |
1661.90 (-2.03%) |
1719.00 |
1646.10 - 1719.00 |
0.5805 times |
Mon 27 October 2025 |
1696.40 (1.9%) |
1658.00 |
1654.80 - 1715.00 |
1.3342 times |
Fri 24 October 2025 |
1664.80 (-0.59%) |
1671.10 |
1652.50 - 1690.90 |
0.66 times |
Thu 23 October 2025 |
1674.60 (-0.92%) |
1685.00 |
1611.10 - 1695.00 |
0.9948 times |
Tue 21 October 2025 |
1690.10 (1.79%) |
1680.00 |
1664.70 - 1697.00 |
0.4067 times |
Mon 20 October 2025 |
1660.30 (1.73%) |
1614.90 |
1614.90 - 1668.00 |
1.0833 times |
Fri 17 October 2025 |
1632.10 (-1.49%) |
1654.00 |
1566.60 - 1654.00 |
1.4562 times |
Thu 16 October 2025 |
1656.80 (3.94%) |
1606.80 |
1596.00 - 1669.00 |
1.2036 times |
Wed 15 October 2025 |
1594.00 (-3.01%) |
1627.10 |
1582.00 - 1633.20 |
0.7693 times |
Tue 14 October 2025 |
1643.50 (-0.94%) |
1663.90 |
1588.10 - 1689.00 |
1.5114 times |
Mon 13 October 2025 |
1659.10 (1.75%) |
1625.00 |
1582.40 - 1668.90 |
1.0326 times |
Weekly price and charts ArmanFinancial Strong weekly Stock price targets for ArmanFinancial ARMANFIN are 1654 and 1726.9 | Weekly Target 1 | 1602.77 | | Weekly Target 2 | 1632.33 | | Weekly Target 3 | 1675.6666666667 | | Weekly Target 4 | 1705.23 | | Weekly Target 5 | 1748.57 |
Weekly price and volumes for Arman Financial
| Date |
Closing |
Open |
Range |
Volume |
Tue 28 October 2025 |
1661.90 (-0.17%) |
1658.00 |
1646.10 - 1719.00 |
0.5469 times |
Fri 24 October 2025 |
1664.80 (2%) |
1614.90 |
1611.10 - 1697.00 |
0.8983 times |
Fri 17 October 2025 |
1632.10 (0.1%) |
1625.00 |
1566.60 - 1689.00 |
1.7063 times |
Fri 10 October 2025 |
1630.50 (8.07%) |
1506.00 |
1495.10 - 1635.10 |
1.115 times |
Fri 03 October 2025 |
1508.70 (2.22%) |
1470.00 |
1436.60 - 1532.60 |
0.7736 times |
Fri 26 September 2025 |
1476.00 (2.05%) |
1454.50 |
1436.10 - 1565.60 |
1.3459 times |
Fri 19 September 2025 |
1446.30 (1.07%) |
1436.00 |
1419.20 - 1490.00 |
1.0663 times |
Fri 12 September 2025 |
1431.00 (-1.28%) |
1449.60 |
1406.10 - 1485.20 |
0.4901 times |
Fri 05 September 2025 |
1449.60 (6.72%) |
1352.20 |
1352.20 - 1468.00 |
0.8205 times |
Fri 29 August 2025 |
1358.30 (-6.74%) |
1456.40 |
1352.00 - 1478.00 |
1.237 times |
Fri 22 August 2025 |
1456.40 (6.15%) |
1373.90 |
1310.70 - 1542.60 |
1.7683 times |
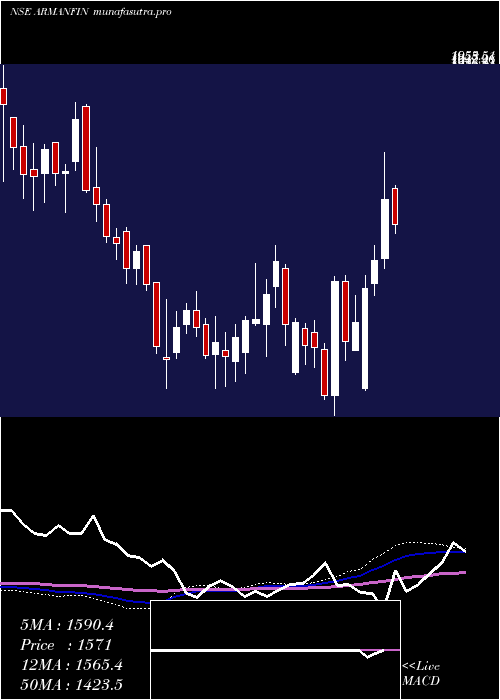
Monthly price and charts ArmanFinancial Strong monthly Stock price targets for ArmanFinancial ARMANFIN are 1556.2 and 1824.7 | Monthly Target 1 | 1341.97 | | Monthly Target 2 | 1501.93 | | Monthly Target 3 | 1610.4666666667 | | Monthly Target 4 | 1770.43 | | Monthly Target 5 | 1878.97 |
Monthly price and volumes Arman Financial
| Date |
Closing |
Open |
Range |
Volume |
Tue 28 October 2025 |
1661.90 (15.08%) |
1452.30 |
1450.50 - 1719.00 |
0.6321 times |
Tue 30 September 2025 |
1444.10 (6.32%) |
1352.20 |
1352.20 - 1565.60 |
0.553 times |
Fri 29 August 2025 |
1358.30 (-16.98%) |
1636.30 |
1270.00 - 1673.90 |
0.8856 times |
Thu 31 July 2025 |
1636.20 (-5.74%) |
1735.00 |
1589.50 - 1834.60 |
0.7208 times |
Mon 30 June 2025 |
1735.90 (8.43%) |
1551.00 |
1426.80 - 1825.00 |
1.7831 times |
Fri 30 May 2025 |
1600.90 (2.71%) |
1570.00 |
1405.00 - 1670.00 |
0.7102 times |
Wed 30 April 2025 |
1558.70 (20.89%) |
1267.65 |
1170.00 - 1744.00 |
1.2157 times |
Fri 28 March 2025 |
1289.40 (0.85%) |
1311.00 |
1109.95 - 1449.00 |
1.5321 times |
Fri 28 February 2025 |
1278.55 (-8.88%) |
1421.45 |
1210.00 - 1520.00 |
0.7133 times |
Fri 31 January 2025 |
1403.10 (13.37%) |
1250.00 |
1192.35 - 1477.80 |
1.254 times |
Tue 31 December 2024 |
1237.65 (-6.41%) |
1328.85 |
1176.00 - 1408.10 |
0.9078 times |
DMA SMA EMA moving averages of Arman Financial ARMANFIN
DMA (daily moving average) of Arman Financial ARMANFIN
| DMA period | DMA value | | 5 day DMA | 1677.56 | | 12 day DMA | 1655.34 | | 20 day DMA | 1598.75 | | 35 day DMA | 1537.29 | | 50 day DMA | 1503.02 | | 100 day DMA | 1585.38 | | 150 day DMA | 1550.23 | | 200 day DMA | 1491.36 | EMA (exponential moving average) of Arman Financial ARMANFIN
| EMA period | EMA current | EMA prev | EMA prev2 | | 5 day EMA | 1669.95 | 1673.98 | 1662.77 | | 12 day EMA | 1643.55 | 1640.21 | 1630 | | 20 day EMA | 1610.12 | 1604.67 | 1595.02 | | 35 day EMA | 1563.1 | 1557.28 | 1549.09 | | 50 day EMA | 1515.48 | 1509.51 | 1501.88 |
SMA (simple moving average) of Arman Financial ARMANFIN
| SMA period | SMA current | SMA prev | SMA prev2 | | 5 day SMA | 1677.56 | 1677.24 | 1664.38 | | 12 day SMA | 1655.34 | 1647.31 | 1635.23 | | 20 day SMA | 1598.75 | 1589.45 | 1579.51 | | 35 day SMA | 1537.29 | 1531.23 | 1523.19 | | 50 day SMA | 1503.02 | 1497.37 | 1491.63 | | 100 day SMA | 1585.38 | 1583.75 | 1581.45 | | 150 day SMA | 1550.23 | 1547.03 | 1543.41 | | 200 day SMA | 1491.36 | 1489.11 | 1486.88 |
|
|
