ArhamTechnologies ARHAM_SM full analysis,charts,indicators,moving averages,SMA,DMA,EMA,ADX,MACD,RSIArham Technologies ARHAM_SM WideScreen charts, DMA,SMA,EMA technical analysis, forecast prediction, by indicators ADX,MACD,RSI,CCI NSE stock exchange
Daily price and charts and targets ArhamTechnologies Strong Daily Stock price targets for ArhamTechnologies ARHAM_SM are 103.28 and 109.18 | Daily Target 1 | 101.92 | | Daily Target 2 | 104.63 | | Daily Target 3 | 107.81666666667 | | Daily Target 4 | 110.53 | | Daily Target 5 | 113.72 |
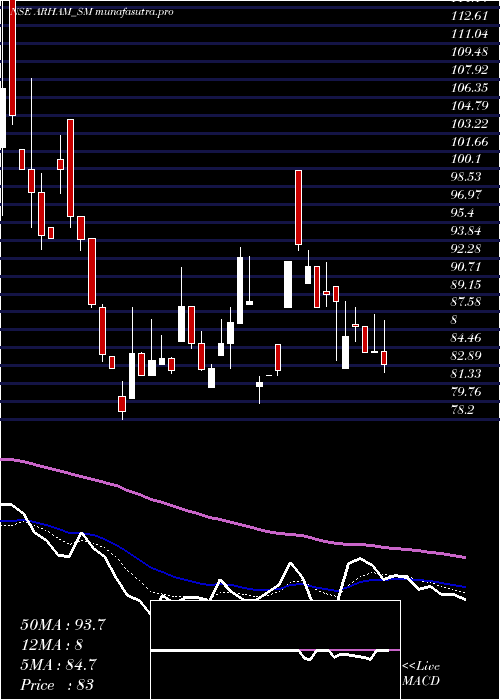
Daily price and volume Arham Technologies
| Date |
Closing |
Open |
Range |
Volume |
Tue 28 October 2025 |
107.35 (-1.69%) |
110.25 |
105.10 - 111.00 |
0.7365 times |
Mon 27 October 2025 |
109.20 (-3.87%) |
112.05 |
109.00 - 112.05 |
0.9348 times |
Fri 24 October 2025 |
113.60 (4.22%) |
110.00 |
108.30 - 115.00 |
1.7847 times |
Thu 23 October 2025 |
109.00 (-2.42%) |
111.75 |
107.00 - 111.95 |
1.0198 times |
Tue 21 October 2025 |
111.70 (1.36%) |
114.50 |
110.00 - 115.10 |
0.9348 times |
Mon 20 October 2025 |
110.20 (6.58%) |
110.00 |
108.50 - 116.00 |
1.8414 times |
Fri 17 October 2025 |
103.40 (1.27%) |
104.80 |
103.05 - 111.00 |
0.9915 times |
Thu 16 October 2025 |
102.10 (3.71%) |
103.50 |
100.00 - 105.85 |
1.2465 times |
Wed 15 October 2025 |
98.45 (1.39%) |
98.00 |
96.00 - 99.80 |
0.3683 times |
Tue 14 October 2025 |
97.10 (-1.92%) |
97.00 |
97.00 - 99.00 |
0.1416 times |
Mon 13 October 2025 |
99.00 (-0.25%) |
98.60 |
95.20 - 99.00 |
0.255 times |
Weekly price and charts ArhamTechnologies Strong weekly Stock price targets for ArhamTechnologies ARHAM_SM are 102.75 and 109.7 | Weekly Target 1 | 101.22 | | Weekly Target 2 | 104.28 | | Weekly Target 3 | 108.16666666667 | | Weekly Target 4 | 111.23 | | Weekly Target 5 | 115.12 |
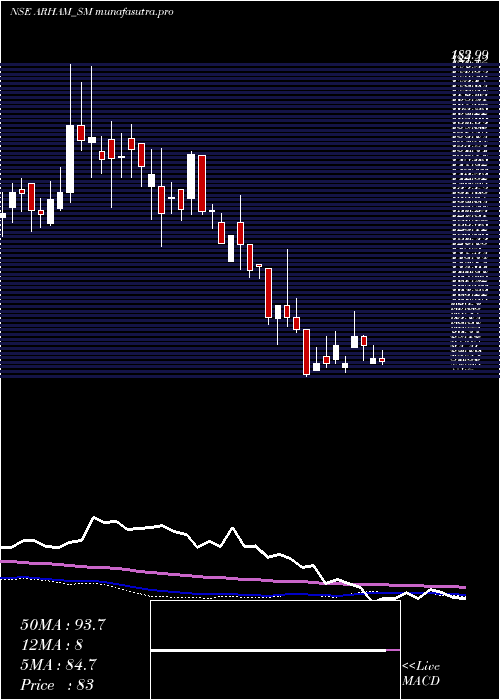
Weekly price and volumes for Arham Technologies
| Date |
Closing |
Open |
Range |
Volume |
Tue 28 October 2025 |
107.35 (-5.5%) |
112.05 |
105.10 - 112.05 |
0.579 times |
Fri 24 October 2025 |
113.60 (9.86%) |
110.00 |
107.00 - 116.00 |
1.9333 times |
Fri 17 October 2025 |
103.40 (4.18%) |
98.60 |
95.20 - 111.00 |
1.0402 times |
Fri 10 October 2025 |
99.25 (-0.75%) |
102.00 |
97.50 - 105.95 |
0.3435 times |
Fri 03 October 2025 |
100.00 (-4.76%) |
104.05 |
97.00 - 104.95 |
0.3533 times |
Fri 26 September 2025 |
105.00 (7.42%) |
99.00 |
99.00 - 117.00 |
1.4033 times |
Fri 19 September 2025 |
97.75 (-1.26%) |
99.05 |
97.00 - 106.00 |
0.4711 times |
Fri 12 September 2025 |
99.00 (-1.98%) |
100.00 |
93.55 - 101.00 |
0.579 times |
Fri 05 September 2025 |
101.00 (-0.93%) |
103.00 |
95.85 - 107.95 |
1.4426 times |
Fri 29 August 2025 |
101.95 (14.55%) |
87.05 |
82.00 - 104.00 |
1.8548 times |
Fri 22 August 2025 |
89.00 (19.95%) |
74.50 |
74.50 - 92.00 |
1.58 times |
Monthly price and charts ArhamTechnologies Strong monthly Stock price targets for ArhamTechnologies ARHAM_SM are 101.28 and 122.08 | Monthly Target 1 | 85.38 | | Monthly Target 2 | 96.37 | | Monthly Target 3 | 106.18333333333 | | Monthly Target 4 | 117.17 | | Monthly Target 5 | 126.98 |
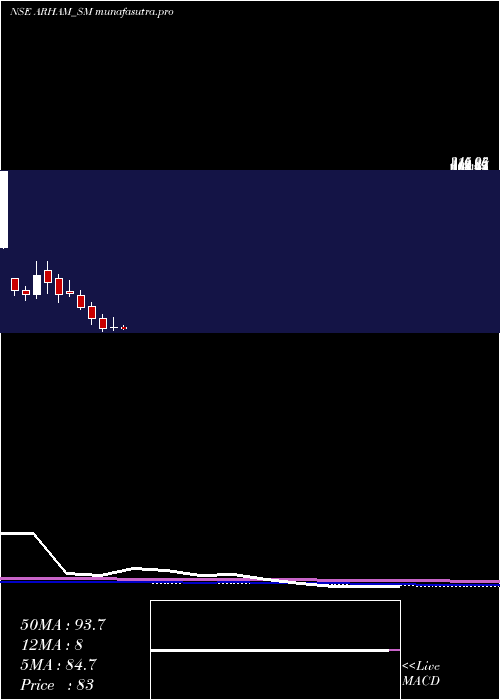
Monthly price and volumes Arham Technologies
| Date |
Closing |
Open |
Range |
Volume |
Tue 28 October 2025 |
107.35 (4.27%) |
103.30 |
95.20 - 116.00 |
1.3659 times |
Tue 30 September 2025 |
102.95 (0.98%) |
103.00 |
93.55 - 117.00 |
1.3528 times |
Fri 29 August 2025 |
101.95 (27.44%) |
79.95 |
70.80 - 104.00 |
1.5067 times |
Thu 31 July 2025 |
80.00 (-8.05%) |
86.20 |
79.00 - 97.00 |
0.9008 times |
Mon 30 June 2025 |
87.00 (-9.66%) |
95.10 |
83.05 - 108.00 |
0.7173 times |
Fri 30 May 2025 |
96.30 (14.57%) |
84.05 |
81.00 - 106.50 |
0.7632 times |
Wed 30 April 2025 |
84.05 (1.69%) |
83.80 |
79.60 - 99.95 |
0.6518 times |
Fri 28 March 2025 |
82.65 (-15.66%) |
98.00 |
78.20 - 104.45 |
1.3167 times |
Fri 28 February 2025 |
98.00 (-13.77%) |
115.95 |
89.00 - 121.00 |
0.6125 times |
Fri 31 January 2025 |
113.65 (-15.72%) |
132.55 |
111.30 - 138.90 |
0.8123 times |
Tue 31 December 2024 |
134.85 (1.39%) |
137.95 |
130.50 - 153.70 |
2.1618 times |
DMA SMA EMA moving averages of Arham Technologies ARHAM_SM
DMA (daily moving average) of Arham Technologies ARHAM_SM
| DMA period | DMA value | | 5 day DMA | 110.17 | | 12 day DMA | 105.03 | | 20 day DMA | 103.72 | | 35 day DMA | 102.92 | | 50 day DMA | 99.15 | | 100 day DMA | 92.82 | | 150 day DMA | 91.54 | | 200 day DMA | 96.97 | EMA (exponential moving average) of Arham Technologies ARHAM_SM
| EMA period | EMA current | EMA prev | EMA prev2 | | 5 day EMA | 108.71 | 109.39 | 109.49 | | 12 day EMA | 106.66 | 106.53 | 106.04 | | 20 day EMA | 104.84 | 104.58 | 104.09 | | 35 day EMA | 101.06 | 100.69 | 100.19 | | 50 day EMA | 98.32 | 97.95 | 97.49 |
SMA (simple moving average) of Arham Technologies ARHAM_SM
| SMA period | SMA current | SMA prev | SMA prev2 | | 5 day SMA | 110.17 | 110.74 | 109.58 | | 12 day SMA | 105.03 | 104.46 | 103.83 | | 20 day SMA | 103.72 | 103.6 | 103.74 | | 35 day SMA | 102.92 | 102.74 | 102.5 | | 50 day SMA | 99.15 | 98.49 | 97.79 | | 100 day SMA | 92.82 | 92.73 | 92.63 | | 150 day SMA | 91.54 | 91.38 | 91.24 | | 200 day SMA | 96.97 | 97.13 | 97.35 |
|
|
