ArabianPetroleum ARABIAN_SM full analysis,charts,indicators,moving averages,SMA,DMA,EMA,ADX,MACD,RSIArabian Petroleum ARABIAN_SM WideScreen charts, DMA,SMA,EMA technical analysis, forecast prediction, by indicators ADX,MACD,RSI,CCI NSE stock exchange
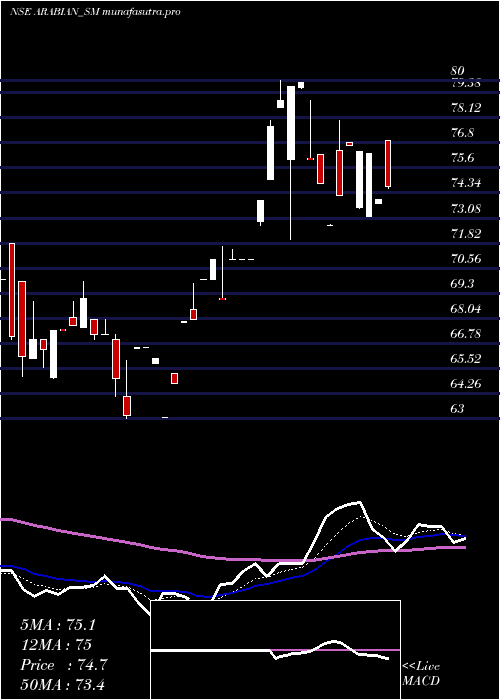
Daily price and charts and targets ArabianPetroleum Strong Daily Stock price targets for ArabianPetroleum ARABIAN_SM are 71.5 and 74.1 | Daily Target 1 | 69.33 | | Daily Target 2 | 71.07 | | Daily Target 3 | 71.933333333333 | | Daily Target 4 | 73.67 | | Daily Target 5 | 74.53 |
Daily price and volume Arabian Petroleum
| Date |
Closing |
Open |
Range |
Volume |
Wed 29 October 2025 |
72.80 (-0.27%) |
70.55 |
70.20 - 72.80 |
1.7857 times |
Fri 24 October 2025 |
73.00 (0.34%) |
74.00 |
73.00 - 74.00 |
0.7143 times |
Thu 23 October 2025 |
72.75 (0.97%) |
72.75 |
72.75 - 72.75 |
0.3571 times |
Mon 20 October 2025 |
72.05 (-5.13%) |
77.95 |
72.05 - 77.95 |
0.7143 times |
Fri 17 October 2025 |
75.95 (2.77%) |
76.60 |
75.75 - 76.60 |
1.0714 times |
Thu 16 October 2025 |
73.90 (3.36%) |
71.50 |
71.10 - 73.90 |
2.1429 times |
Wed 15 October 2025 |
71.50 (-2.05%) |
71.50 |
71.50 - 71.50 |
0.3571 times |
Tue 14 October 2025 |
73.00 (-2.54%) |
71.00 |
71.00 - 73.00 |
1.0714 times |
Mon 13 October 2025 |
74.90 (6.39%) |
74.90 |
74.90 - 74.90 |
0.3571 times |
Fri 10 October 2025 |
70.40 (0.28%) |
71.00 |
70.10 - 71.00 |
1.4286 times |
Thu 09 October 2025 |
70.20 (0.29%) |
70.20 |
70.20 - 70.20 |
0.3571 times |
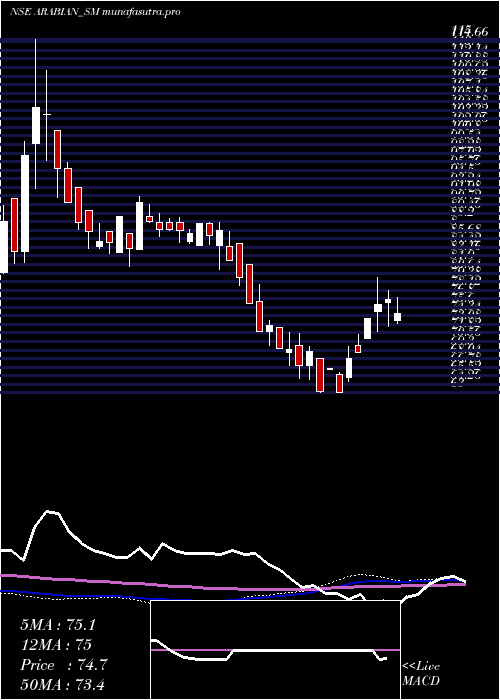
Weekly price and charts ArabianPetroleum Strong weekly Stock price targets for ArabianPetroleum ARABIAN_SM are 71.5 and 74.1 | Weekly Target 1 | 69.33 | | Weekly Target 2 | 71.07 | | Weekly Target 3 | 71.933333333333 | | Weekly Target 4 | 73.67 | | Weekly Target 5 | 74.53 |
Weekly price and volumes for Arabian Petroleum
| Date |
Closing |
Open |
Range |
Volume |
Wed 29 October 2025 |
72.80 (-0.27%) |
70.55 |
70.20 - 72.80 |
0.7463 times |
Fri 24 October 2025 |
73.00 (-3.88%) |
77.95 |
72.05 - 77.95 |
0.7463 times |
Fri 17 October 2025 |
75.95 (7.88%) |
74.90 |
71.00 - 76.60 |
2.0896 times |
Fri 10 October 2025 |
70.40 (-2.22%) |
71.50 |
70.00 - 71.50 |
1.194 times |
Fri 03 October 2025 |
72.00 (-2.17%) |
73.60 |
70.35 - 73.95 |
2.0896 times |
Thu 25 September 2025 |
73.60 (-3.16%) |
73.55 |
73.00 - 73.60 |
0.7463 times |
Thu 18 September 2025 |
76.00 (-0.65%) |
76.50 |
74.05 - 76.50 |
1.194 times |
Thu 11 September 2025 |
76.50 (-0.65%) |
75.00 |
75.00 - 76.50 |
0.7463 times |
Thu 04 September 2025 |
77.00 (3.01%) |
77.95 |
77.00 - 77.95 |
0.2985 times |
Thu 28 August 2025 |
74.75 (-0.66%) |
74.75 |
74.75 - 74.75 |
0.1493 times |
Thu 21 August 2025 |
75.25 (-2.27%) |
75.00 |
75.00 - 76.45 |
1.791 times |
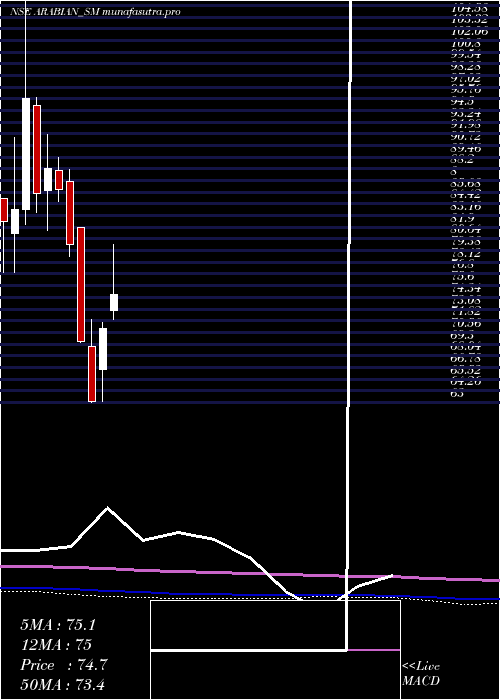
Monthly price and charts ArabianPetroleum Strong monthly Stock price targets for ArabianPetroleum ARABIAN_SM are 71.4 and 79.35 | Monthly Target 1 | 65.63 | | Monthly Target 2 | 69.22 | | Monthly Target 3 | 73.583333333333 | | Monthly Target 4 | 77.17 | | Monthly Target 5 | 81.53 |
Monthly price and volumes Arabian Petroleum
| Date |
Closing |
Open |
Range |
Volume |
Wed 29 October 2025 |
72.80 (2.97%) |
70.70 |
70.00 - 77.95 |
0.4421 times |
Tue 30 September 2025 |
70.70 (-5.42%) |
77.95 |
70.35 - 77.95 |
0.3465 times |
Thu 28 August 2025 |
74.75 (-9.94%) |
83.00 |
74.75 - 83.00 |
0.2987 times |
Thu 31 July 2025 |
83.00 (1.84%) |
84.00 |
78.05 - 88.80 |
1.3023 times |
Mon 30 June 2025 |
81.50 (9.54%) |
76.10 |
70.00 - 92.95 |
1.2186 times |
Fri 30 May 2025 |
74.40 (4.79%) |
72.90 |
72.00 - 80.00 |
1.4337 times |
Wed 30 April 2025 |
71.00 (12.43%) |
66.50 |
63.05 - 71.65 |
0.4659 times |
Fri 28 March 2025 |
63.15 (-9.2%) |
69.00 |
63.00 - 71.95 |
1.8996 times |
Fri 28 February 2025 |
69.55 (-13.06%) |
81.85 |
69.50 - 81.85 |
1.0633 times |
Fri 31 January 2025 |
80.00 (-6.92%) |
86.85 |
78.75 - 88.10 |
1.5293 times |
Tue 31 December 2024 |
85.95 (-2.61%) |
88.05 |
84.70 - 89.40 |
1.4337 times |
DMA SMA EMA moving averages of Arabian Petroleum ARABIAN_SM
DMA (daily moving average) of Arabian Petroleum ARABIAN_SM
| DMA period | DMA value | | 5 day DMA | 73.31 | | 12 day DMA | 72.54 | | 20 day DMA | 72.46 | | 35 day DMA | 74 | | 50 day DMA | 77.01 | | 100 day DMA | 77.51 | | 150 day DMA | 75.25 | | 200 day DMA | 78.11 | EMA (exponential moving average) of Arabian Petroleum ARABIAN_SM
| EMA period | EMA current | EMA prev | EMA prev2 | | 5 day EMA | 72.96 | 73.04 | 73.06 | | 12 day EMA | 72.9 | 72.92 | 72.9 | | 20 day EMA | 73.28 | 73.33 | 73.37 | | 35 day EMA | 75.02 | 75.15 | 75.28 | | 50 day EMA | 77.02 | 77.19 | 77.36 |
SMA (simple moving average) of Arabian Petroleum ARABIAN_SM
| SMA period | SMA current | SMA prev | SMA prev2 | | 5 day SMA | 73.31 | 73.53 | 73.23 | | 12 day SMA | 72.54 | 72.43 | 72.35 | | 20 day SMA | 72.46 | 72.5 | 72.65 | | 35 day SMA | 74 | 74.19 | 74.4 | | 50 day SMA | 77.01 | 77.19 | 77.37 | | 100 day SMA | 77.51 | 77.49 | 77.47 | | 150 day SMA | 75.25 | 75.3 | 75.35 | | 200 day SMA | 78.11 | 78.18 | 78.26 |
|
|
