AptusValue APTUS full analysis,charts,indicators,moving averages,SMA,DMA,EMA,ADX,MACD,RSIAptus Value APTUS WideScreen charts, DMA,SMA,EMA technical analysis, forecast prediction, by indicators ADX,MACD,RSI,CCI NSE stock exchange
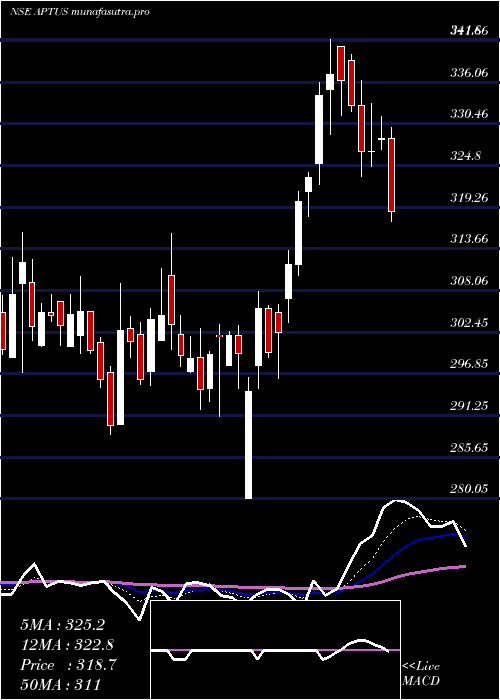
Daily price and charts and targets AptusValue Strong Daily Stock price targets for AptusValue APTUS are 308.5 and 314.75 | Daily Target 1 | 307.37 | | Daily Target 2 | 309.63 | | Daily Target 3 | 313.61666666667 | | Daily Target 4 | 315.88 | | Daily Target 5 | 319.87 |
Daily price and volume Aptus Value
| Date |
Closing |
Open |
Range |
Volume |
Tue 28 October 2025 |
311.90 (-0.57%) |
313.90 |
311.35 - 317.60 |
0.7732 times |
Mon 27 October 2025 |
313.70 (-1.85%) |
322.35 |
311.40 - 322.35 |
1.4625 times |
Fri 24 October 2025 |
319.60 (3.11%) |
312.25 |
309.60 - 320.60 |
1.1713 times |
Thu 23 October 2025 |
309.95 (-1.65%) |
319.20 |
308.25 - 319.35 |
1.3519 times |
Tue 21 October 2025 |
315.15 (0.06%) |
319.45 |
313.00 - 319.45 |
0.2824 times |
Mon 20 October 2025 |
314.95 (1.61%) |
310.00 |
305.95 - 317.80 |
1.3138 times |
Fri 17 October 2025 |
309.95 (1.57%) |
305.10 |
303.45 - 312.00 |
1.2159 times |
Thu 16 October 2025 |
305.15 (-1.36%) |
309.35 |
303.55 - 311.10 |
1.1217 times |
Wed 15 October 2025 |
309.35 (-0.99%) |
313.00 |
308.50 - 314.65 |
0.6284 times |
Tue 14 October 2025 |
312.45 (0.43%) |
312.00 |
306.95 - 314.00 |
0.679 times |
Mon 13 October 2025 |
311.10 (-2.26%) |
316.00 |
309.80 - 316.00 |
0.7028 times |
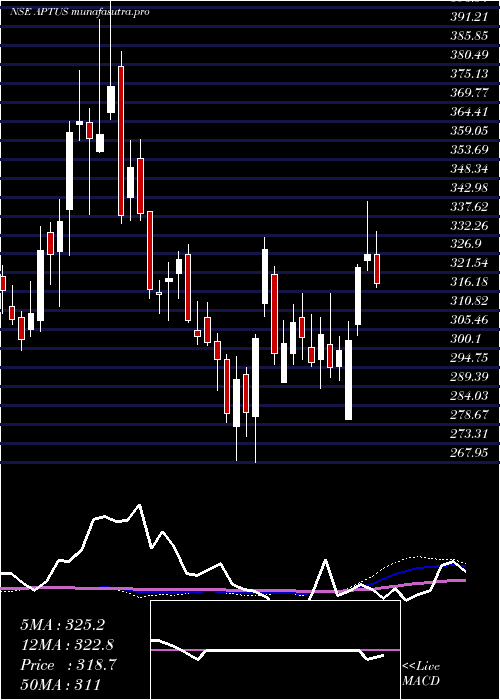
Weekly price and charts AptusValue Strong weekly Stock price targets for AptusValue APTUS are 306.13 and 317.13 | Weekly Target 1 | 304.2 | | Weekly Target 2 | 308.05 | | Weekly Target 3 | 315.2 | | Weekly Target 4 | 319.05 | | Weekly Target 5 | 326.2 |
Weekly price and volumes for Aptus Value
| Date |
Closing |
Open |
Range |
Volume |
Tue 28 October 2025 |
311.90 (-2.41%) |
322.35 |
311.35 - 322.35 |
0.1638 times |
Fri 24 October 2025 |
319.60 (3.11%) |
310.00 |
305.95 - 320.60 |
0.3019 times |
Fri 17 October 2025 |
309.95 (-2.62%) |
316.00 |
303.45 - 316.00 |
0.3186 times |
Fri 10 October 2025 |
318.30 (-2.41%) |
326.10 |
304.55 - 326.15 |
0.5713 times |
Fri 03 October 2025 |
326.15 (4.59%) |
313.40 |
308.85 - 332.00 |
0.6788 times |
Fri 26 September 2025 |
311.85 (-6.27%) |
329.85 |
307.85 - 329.85 |
0.6723 times |
Fri 19 September 2025 |
332.70 (0.27%) |
332.90 |
326.60 - 338.55 |
0.9415 times |
Fri 12 September 2025 |
331.80 (-1.85%) |
340.00 |
330.25 - 353.25 |
1.0509 times |
Fri 05 September 2025 |
338.05 (6.44%) |
318.45 |
316.20 - 345.00 |
4.9373 times |
Fri 29 August 2025 |
317.60 (-8.19%) |
345.00 |
315.00 - 349.50 |
0.3638 times |
Fri 22 August 2025 |
345.95 (-2.82%) |
360.00 |
344.15 - 364.00 |
0.3359 times |
Monthly price and charts AptusValue Strong monthly Stock price targets for AptusValue APTUS are 293.4 and 321.95 | Monthly Target 1 | 287.23 | | Monthly Target 2 | 299.57 | | Monthly Target 3 | 315.78333333333 | | Monthly Target 4 | 328.12 | | Monthly Target 5 | 344.33 |
Monthly price and volumes Aptus Value
| Date |
Closing |
Open |
Range |
Volume |
Tue 28 October 2025 |
311.90 (-2.46%) |
320.90 |
303.45 - 332.00 |
0.5482 times |
Tue 30 September 2025 |
319.75 (0.68%) |
318.45 |
307.85 - 353.25 |
2.4455 times |
Fri 29 August 2025 |
317.60 (-3.07%) |
329.00 |
315.00 - 364.00 |
0.6133 times |
Thu 31 July 2025 |
327.65 (1.14%) |
324.00 |
317.65 - 354.80 |
1.0008 times |
Mon 30 June 2025 |
323.95 (-4.9%) |
339.00 |
303.55 - 340.60 |
3.7676 times |
Fri 30 May 2025 |
340.65 (6.9%) |
318.95 |
312.60 - 348.80 |
0.3897 times |
Wed 30 April 2025 |
318.65 (8.11%) |
294.90 |
280.05 - 341.80 |
0.2952 times |
Fri 28 March 2025 |
294.75 (-4.16%) |
308.95 |
288.70 - 315.75 |
0.2124 times |
Fri 28 February 2025 |
307.55 (1.5%) |
313.00 |
290.40 - 331.70 |
0.2729 times |
Fri 31 January 2025 |
303.00 (4.68%) |
291.55 |
267.95 - 304.05 |
0.4544 times |
Tue 31 December 2024 |
289.45 (-9.55%) |
321.50 |
288.20 - 329.50 |
0.5549 times |

DMA SMA EMA moving averages of Aptus Value APTUS
DMA (daily moving average) of Aptus Value APTUS
| DMA period | DMA value | | 5 day DMA | 314.06 | | 12 day DMA | 312.63 | | 20 day DMA | 314.87 | | 35 day DMA | 321.63 | | 50 day DMA | 326.83 | | 100 day DMA | 329.66 | | 150 day DMA | 326.15 | | 200 day DMA | 319.36 | EMA (exponential moving average) of Aptus Value APTUS
| EMA period | EMA current | EMA prev | EMA prev2 | | 5 day EMA | 313.41 | 314.17 | 314.41 | | 12 day EMA | 313.8 | 314.15 | 314.23 | | 20 day EMA | 315.82 | 316.23 | 316.5 | | 35 day EMA | 320.9 | 321.43 | 321.89 | | 50 day EMA | 326.62 | 327.22 | 327.77 |
SMA (simple moving average) of Aptus Value APTUS
| SMA period | SMA current | SMA prev | SMA prev2 | | 5 day SMA | 314.06 | 314.67 | 313.92 | | 12 day SMA | 312.63 | 312.43 | 312.09 | | 20 day SMA | 314.87 | 314.87 | 315.02 | | 35 day SMA | 321.63 | 322.38 | 322.81 | | 50 day SMA | 326.83 | 327.49 | 328.11 | | 100 day SMA | 329.66 | 329.62 | 329.55 | | 150 day SMA | 326.15 | 326.07 | 326 | | 200 day SMA | 319.36 | 319.24 | 319.16 |
|
|
