AprameyaEngineering APRAMEYA_SM full analysis,charts,indicators,moving averages,SMA,DMA,EMA,ADX,MACD,RSIAprameya Engineering APRAMEYA_SM WideScreen charts, DMA,SMA,EMA technical analysis, forecast prediction, by indicators ADX,MACD,RSI,CCI NSE stock exchange
Daily price and charts and targets AprameyaEngineering Strong Daily Stock price targets for AprameyaEngineering APRAMEYA_SM are 272.5 and 275.5 | Daily Target 1 | 272 | | Daily Target 2 | 273 | | Daily Target 3 | 275 | | Daily Target 4 | 276 | | Daily Target 5 | 278 |
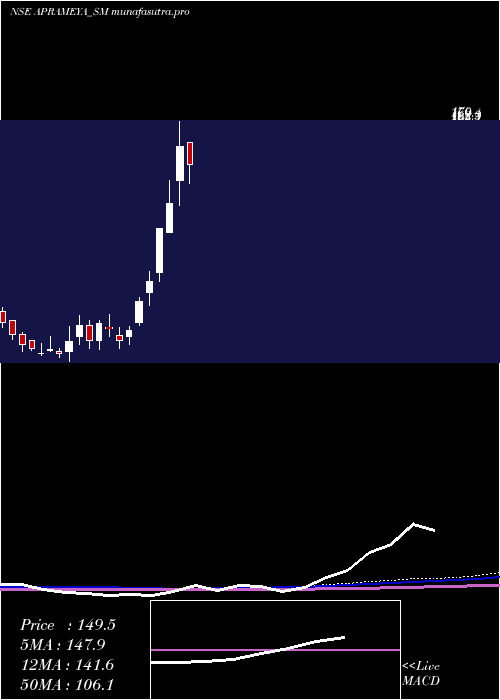
Daily price and volume Aprameya Engineering
| Date |
Closing |
Open |
Range |
Volume |
Wed 29 October 2025 |
274.00 (-1.08%) |
277.00 |
274.00 - 277.00 |
0.3333 times |
Tue 28 October 2025 |
277.00 (1.47%) |
275.00 |
275.00 - 281.00 |
1.3333 times |
Mon 27 October 2025 |
273.00 (-0.73%) |
299.00 |
270.00 - 299.00 |
1.4444 times |
Fri 24 October 2025 |
275.00 (2.23%) |
270.00 |
270.00 - 275.00 |
0.3333 times |
Thu 23 October 2025 |
269.00 (3.86%) |
260.00 |
260.00 - 269.00 |
1.1111 times |
Mon 20 October 2025 |
259.00 (0.97%) |
259.00 |
259.00 - 259.00 |
0.2222 times |
Fri 17 October 2025 |
256.50 (-2.55%) |
263.00 |
254.05 - 263.00 |
1 times |
Thu 16 October 2025 |
263.20 (0.08%) |
270.00 |
260.40 - 270.00 |
0.4444 times |
Wed 15 October 2025 |
263.00 (4.8%) |
251.00 |
251.00 - 263.00 |
1.4444 times |
Tue 14 October 2025 |
250.95 (-4.16%) |
262.00 |
250.00 - 262.00 |
2.3333 times |
Mon 13 October 2025 |
261.85 (6.68%) |
245.45 |
245.45 - 261.85 |
1 times |

Weekly price and charts AprameyaEngineering Strong weekly Stock price targets for AprameyaEngineering APRAMEYA_SM are 257.5 and 286.5 | Weekly Target 1 | 252 | | Weekly Target 2 | 263 | | Weekly Target 3 | 281 | | Weekly Target 4 | 292 | | Weekly Target 5 | 310 |
Weekly price and volumes for Aprameya Engineering
| Date |
Closing |
Open |
Range |
Volume |
Wed 29 October 2025 |
274.00 (-0.36%) |
299.00 |
270.00 - 299.00 |
0.2284 times |
Fri 24 October 2025 |
275.00 (7.21%) |
259.00 |
259.00 - 275.00 |
0.1223 times |
Fri 17 October 2025 |
256.50 (4.5%) |
245.45 |
245.45 - 270.00 |
0.4568 times |
Fri 10 October 2025 |
245.45 (-15.36%) |
301.00 |
223.00 - 304.00 |
1.615 times |
Fri 03 October 2025 |
290.00 (2.04%) |
262.05 |
262.05 - 307.95 |
0.6933 times |
Fri 26 September 2025 |
284.20 (1.94%) |
280.00 |
265.00 - 292.95 |
0.416 times |
Fri 19 September 2025 |
278.80 (0.67%) |
287.95 |
253.00 - 294.20 |
1.4111 times |
Fri 12 September 2025 |
276.95 (58.67%) |
235.00 |
233.05 - 298.95 |
2.0473 times |
Fri 06 June 2025 |
174.55 (6.92%) |
161.00 |
156.00 - 188.35 |
2.5367 times |
Fri 30 May 2025 |
163.25 (9.2%) |
148.00 |
148.00 - 164.85 |
0.4731 times |
Fri 23 May 2025 |
149.50 (-5.38%) |
160.00 |
140.30 - 160.00 |
1.1501 times |
Monthly price and charts AprameyaEngineering Strong monthly Stock price targets for AprameyaEngineering APRAMEYA_SM are 248.5 and 333.45 | Monthly Target 1 | 183.37 | | Monthly Target 2 | 228.68 | | Monthly Target 3 | 268.31666666667 | | Monthly Target 4 | 313.63 | | Monthly Target 5 | 353.27 |
Monthly price and volumes Aprameya Engineering
| Date |
Closing |
Open |
Range |
Volume |
Wed 29 October 2025 |
274.00 (0.55%) |
268.00 |
223.00 - 307.95 |
0.4287 times |
Tue 30 September 2025 |
272.50 (56.12%) |
235.00 |
233.05 - 298.95 |
0.589 times |
Fri 06 June 2025 |
174.55 (6.92%) |
161.00 |
156.00 - 188.35 |
0.3693 times |
Fri 30 May 2025 |
163.25 (37.36%) |
117.00 |
117.00 - 170.00 |
1.2457 times |
Wed 11 December 2024 |
118.85 (42.17%) |
87.95 |
81.80 - 118.85 |
1.1614 times |
Fri 29 November 2024 |
83.60 (29.31%) |
66.65 |
61.15 - 85.90 |
2.014 times |
Thu 31 October 2024 |
64.65 (7.75%) |
60.00 |
55.00 - 76.95 |
1.7147 times |
Mon 30 September 2024 |
60.00 (-11.57%) |
68.00 |
58.00 - 68.80 |
0.6341 times |
Fri 30 August 2024 |
67.85 (0%) |
81.00 |
65.50 - 81.00 |
0.8431 times |
Wed 29 October 2025 |
(0%) |
|
- |
0 times |

DMA SMA EMA moving averages of Aprameya Engineering APRAMEYA_SM
DMA (daily moving average) of Aprameya Engineering APRAMEYA_SM
| DMA period | DMA value | | 5 day DMA | 273.6 | | 12 day DMA | 264 | | 20 day DMA | 268.65 | | 35 day DMA | 270.48 | | 50 day DMA | 236.5 | | 100 day DMA | 162 | | 150 day DMA | | | 200 day DMA | | EMA (exponential moving average) of Aprameya Engineering APRAMEYA_SM
| EMA period | EMA current | EMA prev | EMA prev2 | | 5 day EMA | 272.35 | 271.53 | 268.79 | | 12 day EMA | 268.93 | 268.01 | 266.38 | | 20 day EMA | 265.63 | 264.75 | 263.46 | | 35 day EMA | 248.18 | 246.66 | 244.87 | | 50 day EMA | 232.9 | 231.22 | 229.35 |
SMA (simple moving average) of Aprameya Engineering APRAMEYA_SM
| SMA period | SMA current | SMA prev | SMA prev2 | | 5 day SMA | 273.6 | 270.6 | 266.5 | | 12 day SMA | 264 | 262.18 | 261.61 | | 20 day SMA | 268.65 | 269.16 | 269.75 | | 35 day SMA | 270.48 | 267.64 | 264.88 | | 50 day SMA | 236.5 | 234.18 | 231.8 | | 100 day SMA | 162 | 159.92 | 157.8 | | 150 day SMA | | 200 day SMA |
|
|
