ApolloSindoori APOLSINHOT full analysis,charts,indicators,moving averages,SMA,DMA,EMA,ADX,MACD,RSIApollo Sindoori APOLSINHOT WideScreen charts, DMA,SMA,EMA technical analysis, forecast prediction, by indicators ADX,MACD,RSI,CCI NSE stock exchange
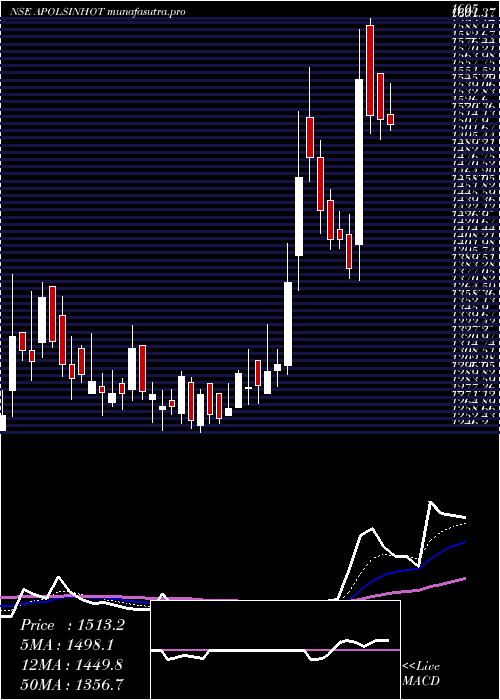
Daily price and charts and targets ApolloSindoori Strong Daily Stock price targets for ApolloSindoori APOLSINHOT are 1281.75 and 1339.75 | Daily Target 1 | 1268.5 | | Daily Target 2 | 1295 | | Daily Target 3 | 1326.5 | | Daily Target 4 | 1353 | | Daily Target 5 | 1384.5 |
Daily price and volume Apollo Sindoori
| Date |
Closing |
Open |
Range |
Volume |
Tue 28 October 2025 |
1321.50 (-0.44%) |
1358.00 |
1300.00 - 1358.00 |
1.1915 times |
Mon 27 October 2025 |
1327.30 (-1.36%) |
1340.00 |
1318.20 - 1349.90 |
0.7362 times |
Fri 24 October 2025 |
1345.60 (-0.33%) |
1347.00 |
1307.20 - 1352.00 |
1.83 times |
Thu 23 October 2025 |
1350.00 (0.42%) |
1344.00 |
1339.00 - 1364.90 |
0.6261 times |
Tue 21 October 2025 |
1344.30 (1.14%) |
1325.10 |
1321.00 - 1361.00 |
0.3205 times |
Mon 20 October 2025 |
1329.10 (-1.21%) |
1322.00 |
1322.00 - 1351.90 |
0.7671 times |
Fri 17 October 2025 |
1345.40 (1.85%) |
1333.00 |
1325.00 - 1359.70 |
1.7372 times |
Thu 16 October 2025 |
1320.90 (1.27%) |
1312.60 |
1302.10 - 1328.40 |
0.8352 times |
Wed 15 October 2025 |
1304.30 (-0.39%) |
1310.80 |
1291.30 - 1314.30 |
0.6706 times |
Tue 14 October 2025 |
1309.40 (-1.24%) |
1312.00 |
1300.00 - 1321.10 |
1.2856 times |
Mon 13 October 2025 |
1325.90 (-0.38%) |
1331.00 |
1310.00 - 1350.00 |
1.0765 times |
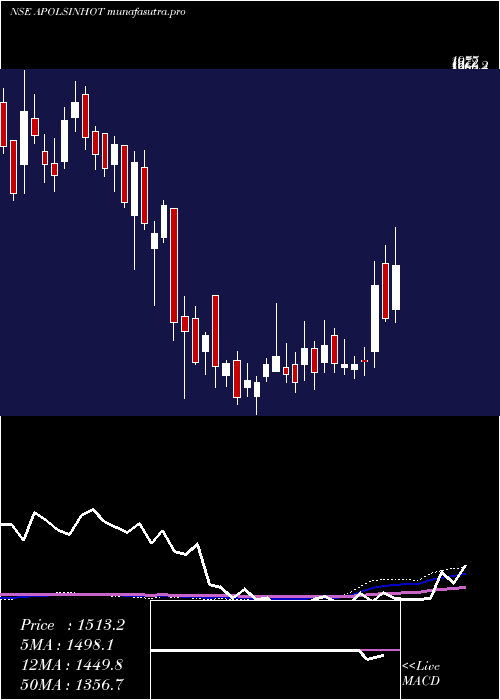
Weekly price and charts ApolloSindoori Strong weekly Stock price targets for ApolloSindoori APOLSINHOT are 1281.75 and 1339.75 | Weekly Target 1 | 1268.5 | | Weekly Target 2 | 1295 | | Weekly Target 3 | 1326.5 | | Weekly Target 4 | 1353 | | Weekly Target 5 | 1384.5 |
Weekly price and volumes for Apollo Sindoori
| Date |
Closing |
Open |
Range |
Volume |
Tue 28 October 2025 |
1321.50 (-1.79%) |
1340.00 |
1300.00 - 1358.00 |
0.3398 times |
Fri 24 October 2025 |
1345.60 (0.01%) |
1322.00 |
1307.20 - 1364.90 |
0.6246 times |
Fri 17 October 2025 |
1345.40 (1.08%) |
1331.00 |
1291.30 - 1359.70 |
0.9879 times |
Fri 10 October 2025 |
1331.00 (-1.36%) |
1349.30 |
1302.10 - 1372.10 |
0.9796 times |
Fri 03 October 2025 |
1349.30 (-0.79%) |
1394.00 |
1324.70 - 1394.00 |
0.3304 times |
Fri 26 September 2025 |
1360.10 (-4.43%) |
1423.10 |
1355.10 - 1443.00 |
1.04 times |
Fri 19 September 2025 |
1423.20 (0.81%) |
1426.00 |
1376.70 - 1450.10 |
1.3292 times |
Fri 12 September 2025 |
1411.80 (-2.14%) |
1449.90 |
1346.70 - 1457.60 |
1.5361 times |
Fri 05 September 2025 |
1442.60 (6.25%) |
1375.00 |
1338.50 - 1479.00 |
2.2608 times |
Fri 29 August 2025 |
1357.70 (-4.22%) |
1409.00 |
1340.00 - 1446.20 |
0.5718 times |
Fri 22 August 2025 |
1417.50 (-0.89%) |
1432.00 |
1394.70 - 1478.00 |
1.0721 times |
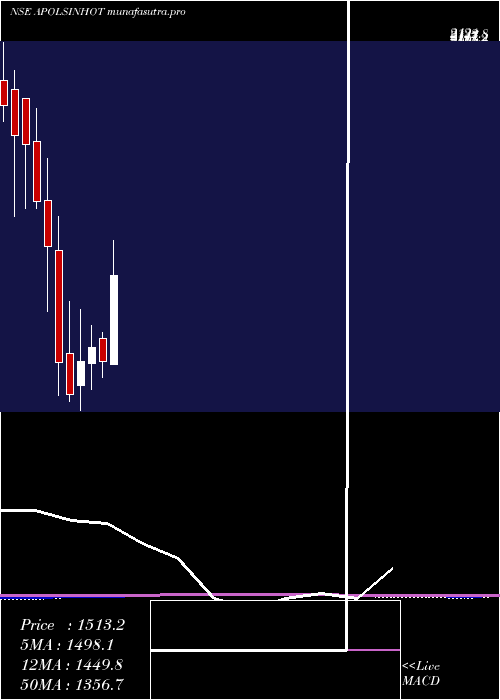
Monthly price and charts ApolloSindoori Strong monthly Stock price targets for ApolloSindoori APOLSINHOT are 1266 and 1346.8 | Monthly Target 1 | 1247.5 | | Monthly Target 2 | 1284.5 | | Monthly Target 3 | 1328.3 | | Monthly Target 4 | 1365.3 | | Monthly Target 5 | 1409.1 |
Monthly price and volumes Apollo Sindoori
| Date |
Closing |
Open |
Range |
Volume |
Tue 28 October 2025 |
1321.50 (-1.81%) |
1370.00 |
1291.30 - 1372.10 |
0.3074 times |
Tue 30 September 2025 |
1345.80 (-0.88%) |
1375.00 |
1325.00 - 1479.00 |
0.617 times |
Fri 29 August 2025 |
1357.70 (-1.87%) |
1378.00 |
1300.00 - 1491.20 |
0.5102 times |
Thu 31 July 2025 |
1383.60 (7.5%) |
1280.00 |
1280.00 - 1605.00 |
2.8865 times |
Mon 30 June 2025 |
1287.10 (-2.88%) |
1348.00 |
1246.20 - 1363.90 |
0.8844 times |
Fri 30 May 2025 |
1325.30 (2.95%) |
1282.80 |
1213.20 - 1382.90 |
0.6519 times |
Wed 30 April 2025 |
1287.30 (7.15%) |
1224.35 |
1160.00 - 1424.00 |
0.6575 times |
Fri 28 March 2025 |
1201.40 (-6.44%) |
1309.00 |
1183.65 - 1444.00 |
1.4727 times |
Fri 28 February 2025 |
1284.05 (-19.2%) |
1580.15 |
1198.25 - 1668.95 |
1.1338 times |
Fri 31 January 2025 |
1589.10 (-6.93%) |
1711.00 |
1418.05 - 1820.00 |
0.8786 times |
Tue 31 December 2024 |
1707.35 (-8.09%) |
1866.00 |
1690.00 - 1950.00 |
0.986 times |
DMA SMA EMA moving averages of Apollo Sindoori APOLSINHOT
DMA (daily moving average) of Apollo Sindoori APOLSINHOT
| DMA period | DMA value | | 5 day DMA | 1337.74 | | 12 day DMA | 1329.56 | | 20 day DMA | 1332.52 | | 35 day DMA | 1358.23 | | 50 day DMA | 1372.13 | | 100 day DMA | 1369.47 | | 150 day DMA | 1339.44 | | 200 day DMA | 1371.42 | EMA (exponential moving average) of Apollo Sindoori APOLSINHOT
| EMA period | EMA current | EMA prev | EMA prev2 | | 5 day EMA | 1331.48 | 1336.47 | 1341.06 | | 12 day EMA | 1334.03 | 1336.31 | 1337.95 | | 20 day EMA | 1339.99 | 1341.93 | 1343.47 | | 35 day EMA | 1351.12 | 1352.86 | 1354.37 | | 50 day EMA | 1367.16 | 1369.02 | 1370.72 |
SMA (simple moving average) of Apollo Sindoori APOLSINHOT
| SMA period | SMA current | SMA prev | SMA prev2 | | 5 day SMA | 1337.74 | 1339.26 | 1342.88 | | 12 day SMA | 1329.56 | 1328.28 | 1327.97 | | 20 day SMA | 1332.52 | 1334.45 | 1336.83 | | 35 day SMA | 1358.23 | 1361.69 | 1364.49 | | 50 day SMA | 1372.13 | 1374.84 | 1375.25 | | 100 day SMA | 1369.47 | 1369.23 | 1368.89 | | 150 day SMA | 1339.44 | 1338.91 | 1338.29 | | 200 day SMA | 1371.42 | 1373.42 | 1375.79 |
|
|
