ApolloTyres APOLLOTYRE full analysis,charts,indicators,moving averages,SMA,DMA,EMA,ADX,MACD,RSIApollo Tyres APOLLOTYRE WideScreen charts, DMA,SMA,EMA technical analysis, forecast prediction, by indicators ADX,MACD,RSI,CCI NSE stock exchange
operates under Auto Tyres & Rubber Products sector
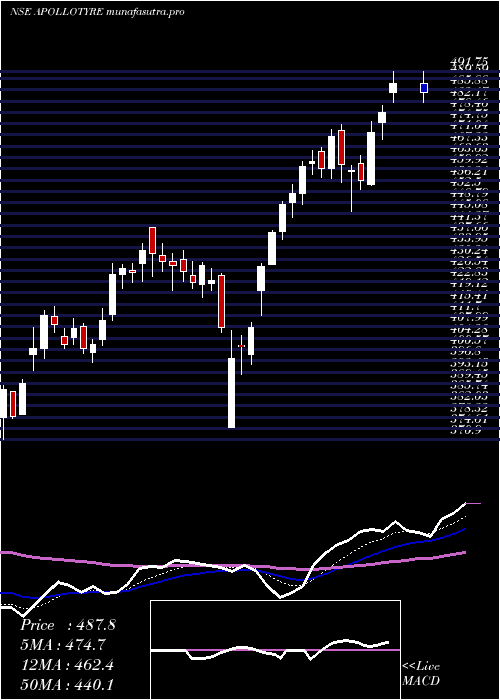
Daily price and charts and targets ApolloTyres Strong Daily Stock price targets for ApolloTyres APOLLOTYRE are 488 and 517.15 | Daily Target 1 | 482.5 | | Daily Target 2 | 493.5 | | Daily Target 3 | 511.65 | | Daily Target 4 | 522.65 | | Daily Target 5 | 540.8 |
Daily price and volume Apollo Tyres
| Date |
Closing |
Open |
Range |
Volume |
Tue 28 October 2025 |
504.50 (-0.21%) |
513.00 |
500.65 - 529.80 |
2.2837 times |
Mon 27 October 2025 |
505.55 (1.15%) |
500.00 |
499.00 - 511.45 |
0.5015 times |
Fri 24 October 2025 |
499.80 (-2.75%) |
514.05 |
497.10 - 517.00 |
0.7474 times |
Thu 23 October 2025 |
513.95 (-0.23%) |
515.00 |
504.25 - 517.00 |
0.9626 times |
Tue 21 October 2025 |
515.15 (1.61%) |
510.00 |
507.40 - 518.00 |
0.3661 times |
Mon 20 October 2025 |
507.00 (3.8%) |
493.40 |
488.75 - 512.55 |
2.3572 times |
Fri 17 October 2025 |
488.45 (-0.31%) |
492.00 |
485.05 - 503.00 |
1.7381 times |
Thu 16 October 2025 |
489.95 (0.65%) |
487.20 |
484.70 - 490.60 |
0.5058 times |
Wed 15 October 2025 |
486.80 (1.27%) |
481.35 |
479.05 - 488.00 |
0.2264 times |
Tue 14 October 2025 |
480.70 (-0.96%) |
486.00 |
477.50 - 488.65 |
0.3112 times |
Mon 13 October 2025 |
485.35 (-0.59%) |
486.55 |
478.75 - 488.00 |
0.2943 times |
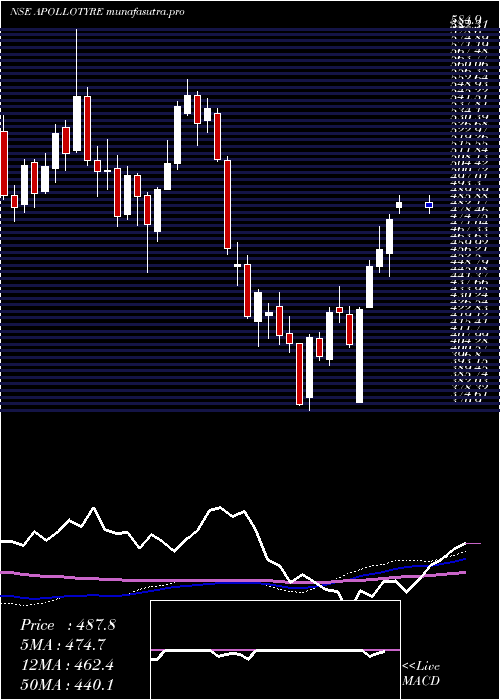
Weekly price and charts ApolloTyres Strong weekly Stock price targets for ApolloTyres APOLLOTYRE are 501.75 and 532.55 | Weekly Target 1 | 480.3 | | Weekly Target 2 | 492.4 | | Weekly Target 3 | 511.1 | | Weekly Target 4 | 523.2 | | Weekly Target 5 | 541.9 |
Weekly price and volumes for Apollo Tyres
| Date |
Closing |
Open |
Range |
Volume |
Tue 28 October 2025 |
504.50 (0.94%) |
500.00 |
499.00 - 529.80 |
0.7464 times |
Fri 24 October 2025 |
499.80 (2.32%) |
493.40 |
488.75 - 518.00 |
1.188 times |
Fri 17 October 2025 |
488.45 (0.04%) |
486.55 |
477.50 - 503.00 |
0.8243 times |
Fri 10 October 2025 |
488.25 (3.19%) |
475.00 |
470.40 - 493.90 |
0.6378 times |
Fri 03 October 2025 |
473.15 (-1.41%) |
483.25 |
463.25 - 483.25 |
0.742 times |
Fri 26 September 2025 |
479.90 (-0.16%) |
483.00 |
472.55 - 497.65 |
1.2041 times |
Fri 19 September 2025 |
480.65 (1.09%) |
476.00 |
470.55 - 499.00 |
1.1346 times |
Fri 12 September 2025 |
475.45 (-1.52%) |
484.95 |
470.00 - 491.00 |
0.7291 times |
Fri 05 September 2025 |
482.80 (4.46%) |
464.50 |
463.25 - 497.80 |
2.2888 times |
Fri 29 August 2025 |
462.20 (-0.76%) |
465.95 |
453.50 - 471.30 |
0.5049 times |
Fri 22 August 2025 |
465.75 (7.74%) |
436.80 |
431.00 - 469.70 |
0.9805 times |
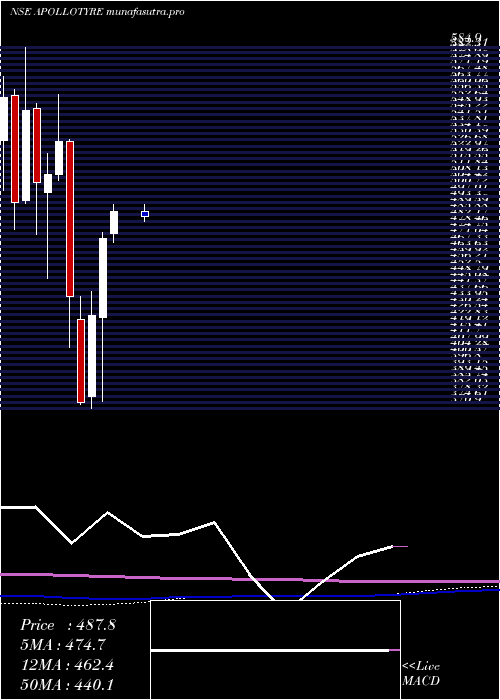
Monthly price and charts ApolloTyres Strong monthly Stock price targets for ApolloTyres APOLLOTYRE are 483.88 and 550.43 | Monthly Target 1 | 432.63 | | Monthly Target 2 | 468.57 | | Monthly Target 3 | 499.18333333333 | | Monthly Target 4 | 535.12 | | Monthly Target 5 | 565.73 |
Monthly price and volumes Apollo Tyres
| Date |
Closing |
Open |
Range |
Volume |
Tue 28 October 2025 |
504.50 (6.67%) |
472.95 |
463.25 - 529.80 |
0.7556 times |
Tue 30 September 2025 |
472.95 (2.33%) |
464.50 |
463.25 - 499.00 |
1.1479 times |
Fri 29 August 2025 |
462.20 (2.78%) |
450.70 |
421.00 - 471.30 |
0.4345 times |
Thu 31 July 2025 |
449.70 (0.2%) |
449.05 |
445.50 - 477.10 |
1.0112 times |
Mon 30 June 2025 |
448.80 (-4.62%) |
467.75 |
435.30 - 477.00 |
0.7322 times |
Fri 30 May 2025 |
470.55 (-0.29%) |
475.00 |
460.10 - 509.80 |
1.4404 times |
Wed 30 April 2025 |
471.90 (10.76%) |
425.00 |
375.00 - 475.30 |
1.0188 times |
Fri 28 March 2025 |
426.05 (13.83%) |
378.10 |
370.90 - 440.65 |
1.0407 times |
Fri 28 February 2025 |
374.30 (-14.41%) |
424.00 |
373.35 - 437.35 |
1.0394 times |
Fri 31 January 2025 |
437.30 (-17.4%) |
529.40 |
407.05 - 530.70 |
1.3791 times |
Tue 31 December 2024 |
529.40 (3.88%) |
509.90 |
506.35 - 557.00 |
1.0231 times |
DMA SMA EMA moving averages of Apollo Tyres APOLLOTYRE
DMA (daily moving average) of Apollo Tyres APOLLOTYRE
| DMA period | DMA value | | 5 day DMA | 507.79 | | 12 day DMA | 497.12 | | 20 day DMA | 488.49 | | 35 day DMA | 486.32 | | 50 day DMA | 480.67 | | 100 day DMA | 466.9 | | 150 day DMA | 464.19 | | 200 day DMA | 453.94 | EMA (exponential moving average) of Apollo Tyres APOLLOTYRE
| EMA period | EMA current | EMA prev | EMA prev2 | | 5 day EMA | 504.24 | 504.11 | 503.39 | | 12 day EMA | 498.58 | 497.5 | 496.04 | | 20 day EMA | 493.39 | 492.22 | 490.82 | | 35 day EMA | 485.6 | 484.49 | 483.25 | | 50 day EMA | 480.01 | 479.01 | 477.93 |
SMA (simple moving average) of Apollo Tyres APOLLOTYRE
| SMA period | SMA current | SMA prev | SMA prev2 | | 5 day SMA | 507.79 | 508.29 | 504.87 | | 12 day SMA | 497.12 | 495.48 | 493.93 | | 20 day SMA | 488.49 | 487.26 | 486.64 | | 35 day SMA | 486.32 | 485.7 | 485.13 | | 50 day SMA | 480.67 | 479.47 | 478.3 | | 100 day SMA | 466.9 | 466.44 | 466.04 | | 150 day SMA | 464.19 | 463.66 | 463.03 | | 200 day SMA | 453.94 | 453.92 | 453.96 |
|
|
