ApolloPipes APOLLOPIPE full analysis,charts,indicators,moving averages,SMA,DMA,EMA,ADX,MACD,RSIApollo Pipes APOLLOPIPE WideScreen charts, DMA,SMA,EMA technical analysis, forecast prediction, by indicators ADX,MACD,RSI,CCI NSE stock exchange
Daily price and charts and targets ApolloPipes Strong Daily Stock price targets for ApolloPipes APOLLOPIPE are 303.05 and 314.95 | Daily Target 1 | 300.77 | | Daily Target 2 | 305.33 | | Daily Target 3 | 312.66666666667 | | Daily Target 4 | 317.23 | | Daily Target 5 | 324.57 |
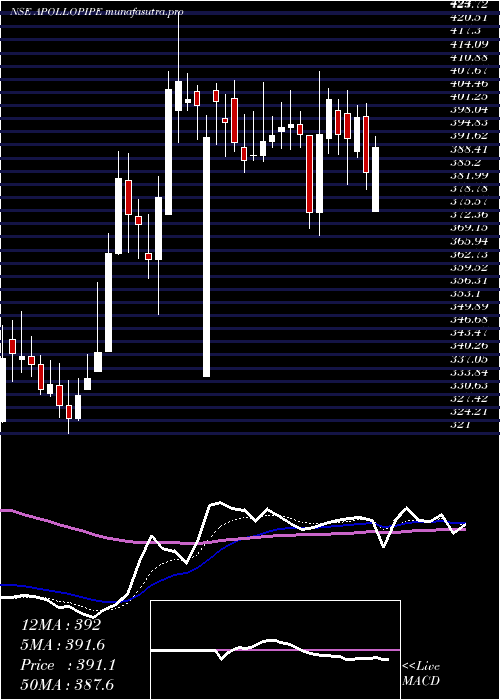
Daily price and volume Apollo Pipes
| Date |
Closing |
Open |
Range |
Volume |
Wed 29 October 2025 |
309.90 (-0.67%) |
316.00 |
308.10 - 320.00 |
2.2466 times |
Tue 28 October 2025 |
312.00 (-0.94%) |
316.50 |
311.00 - 319.90 |
1.0381 times |
Mon 27 October 2025 |
314.95 (-0.14%) |
319.80 |
312.70 - 319.80 |
0.8872 times |
Fri 24 October 2025 |
315.40 (-2.79%) |
328.00 |
313.95 - 329.40 |
1.6303 times |
Thu 23 October 2025 |
324.45 (-2.84%) |
335.00 |
317.80 - 341.45 |
2.4109 times |
Tue 21 October 2025 |
333.95 (0.78%) |
331.35 |
329.55 - 335.00 |
0.1731 times |
Mon 20 October 2025 |
331.35 (-0.33%) |
339.10 |
329.00 - 339.10 |
0.3006 times |
Fri 17 October 2025 |
332.45 (-1.6%) |
337.30 |
329.60 - 341.00 |
0.4797 times |
Thu 16 October 2025 |
337.85 (1.75%) |
334.90 |
332.25 - 341.20 |
0.4183 times |
Wed 15 October 2025 |
332.05 (0.14%) |
334.60 |
329.00 - 335.10 |
0.4154 times |
Tue 14 October 2025 |
331.60 (-0.12%) |
333.80 |
328.00 - 337.00 |
0.681 times |
Weekly price and charts ApolloPipes Strong weekly Stock price targets for ApolloPipes APOLLOPIPE are 303.05 and 314.95 | Weekly Target 1 | 300.77 | | Weekly Target 2 | 305.33 | | Weekly Target 3 | 312.66666666667 | | Weekly Target 4 | 317.23 | | Weekly Target 5 | 324.57 |
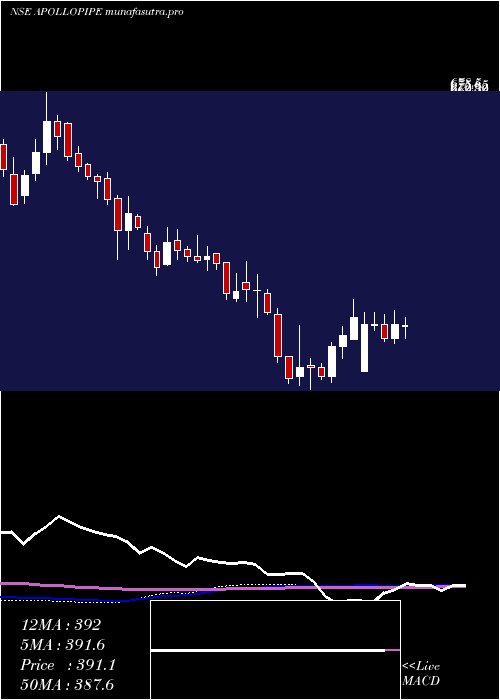
Weekly price and volumes for Apollo Pipes
| Date |
Closing |
Open |
Range |
Volume |
Wed 29 October 2025 |
309.90 (-1.74%) |
319.80 |
308.10 - 320.00 |
1.3839 times |
Fri 24 October 2025 |
315.40 (-5.13%) |
339.10 |
313.95 - 341.45 |
1.4976 times |
Fri 17 October 2025 |
332.45 (-1.07%) |
334.90 |
327.60 - 341.20 |
0.8281 times |
Fri 10 October 2025 |
336.05 (-3.97%) |
350.50 |
330.25 - 362.10 |
1.1971 times |
Fri 03 October 2025 |
349.95 (2.78%) |
340.90 |
331.00 - 357.90 |
1.2739 times |
Fri 26 September 2025 |
340.50 (-15.68%) |
399.00 |
338.95 - 405.20 |
1.4996 times |
Fri 19 September 2025 |
403.80 (3.57%) |
389.95 |
389.95 - 414.25 |
0.8355 times |
Fri 12 September 2025 |
389.90 (-3.33%) |
401.25 |
388.90 - 406.00 |
0.6436 times |
Fri 05 September 2025 |
403.35 (-0.47%) |
405.25 |
400.00 - 419.30 |
0.3402 times |
Fri 29 August 2025 |
405.25 (0.31%) |
404.00 |
383.20 - 407.10 |
0.5005 times |
Fri 22 August 2025 |
404.00 (7.62%) |
380.90 |
378.15 - 418.40 |
0.6846 times |
Monthly price and charts ApolloPipes Strong monthly Stock price targets for ApolloPipes APOLLOPIPE are 282 and 336 | Monthly Target 1 | 272.7 | | Monthly Target 2 | 291.3 | | Monthly Target 3 | 326.7 | | Monthly Target 4 | 345.3 | | Monthly Target 5 | 380.7 |
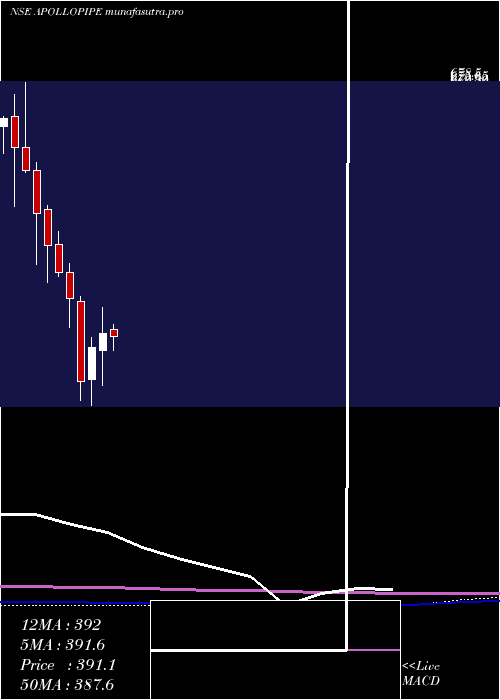
Monthly price and volumes Apollo Pipes
| Date |
Closing |
Open |
Range |
Volume |
Wed 29 October 2025 |
309.90 (-6.94%) |
335.90 |
308.10 - 362.10 |
0.8527 times |
Tue 30 September 2025 |
333.00 (-17.83%) |
405.25 |
331.00 - 419.30 |
0.6627 times |
Fri 29 August 2025 |
405.25 (0.26%) |
401.00 |
374.30 - 418.40 |
0.3555 times |
Thu 31 July 2025 |
404.20 (-5.82%) |
431.30 |
394.20 - 454.00 |
1.074 times |
Mon 30 June 2025 |
429.20 (-6.17%) |
457.40 |
415.55 - 484.00 |
2.0717 times |
Fri 30 May 2025 |
457.40 (16.03%) |
399.40 |
371.95 - 494.95 |
1.9619 times |
Wed 30 April 2025 |
394.20 (4.05%) |
374.65 |
335.00 - 424.00 |
0.5895 times |
Fri 28 March 2025 |
378.85 (11.57%) |
342.10 |
312.80 - 389.90 |
0.9382 times |
Fri 28 February 2025 |
339.55 (-21.83%) |
431.00 |
318.00 - 435.80 |
0.9401 times |
Fri 31 January 2025 |
434.40 (-6.36%) |
463.90 |
401.50 - 473.95 |
0.5535 times |
Tue 31 December 2024 |
463.90 (-6.1%) |
495.50 |
458.95 - 510.00 |
0.3267 times |
DMA SMA EMA moving averages of Apollo Pipes APOLLOPIPE
DMA (daily moving average) of Apollo Pipes APOLLOPIPE
| DMA period | DMA value | | 5 day DMA | 315.34 | | 12 day DMA | 325.66 | | 20 day DMA | 331.23 | | 35 day DMA | 354.83 | | 50 day DMA | 368.81 | | 100 day DMA | 395.6 | | 150 day DMA | 398.89 | | 200 day DMA | 394.84 | EMA (exponential moving average) of Apollo Pipes APOLLOPIPE
| EMA period | EMA current | EMA prev | EMA prev2 | | 5 day EMA | 315.72 | 318.63 | 321.95 | | 12 day EMA | 324.52 | 327.18 | 329.94 | | 20 day EMA | 333.58 | 336.07 | 338.6 | | 35 day EMA | 348.57 | 350.85 | 353.14 | | 50 day EMA | 364.62 | 366.85 | 369.09 |
SMA (simple moving average) of Apollo Pipes APOLLOPIPE
| SMA period | SMA current | SMA prev | SMA prev2 | | 5 day SMA | 315.34 | 320.15 | 324.02 | | 12 day SMA | 325.66 | 327.84 | 329.55 | | 20 day SMA | 331.23 | 332.47 | 333.89 | | 35 day SMA | 354.83 | 357.31 | 359.92 | | 50 day SMA | 368.81 | 370.12 | 371.48 | | 100 day SMA | 395.6 | 396.83 | 398.15 | | 150 day SMA | 398.89 | 399.1 | 399.25 | | 200 day SMA | 394.84 | 395.54 | 396.22 |
|
|
