ApolloMicro APOLLO full analysis,charts,indicators,moving averages,SMA,DMA,EMA,ADX,MACD,RSIApollo Micro APOLLO WideScreen charts, DMA,SMA,EMA technical analysis, forecast prediction, by indicators ADX,MACD,RSI,CCI NSE stock exchange
Daily price and charts and targets ApolloMicro Strong Daily Stock price targets for ApolloMicro APOLLO are 268.2 and 282.9 | Daily Target 1 | 265.5 | | Daily Target 2 | 270.9 | | Daily Target 3 | 280.2 | | Daily Target 4 | 285.6 | | Daily Target 5 | 294.9 |
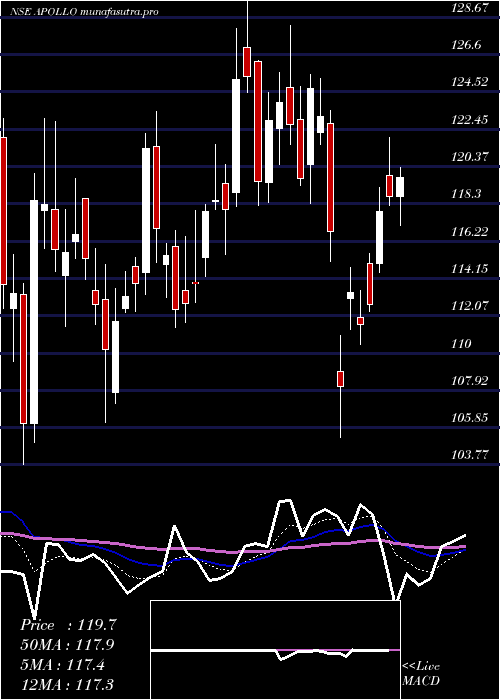
Daily price and volume Apollo Micro
| Date |
Closing |
Open |
Range |
Volume |
Tue 28 October 2025 |
276.30 (-3.14%) |
287.00 |
274.80 - 289.50 |
0.7906 times |
Mon 27 October 2025 |
285.25 (-2.03%) |
292.45 |
284.00 - 293.50 |
0.5423 times |
Fri 24 October 2025 |
291.15 (0.57%) |
291.00 |
289.55 - 297.50 |
0.7205 times |
Thu 23 October 2025 |
289.50 (-2.95%) |
302.20 |
286.15 - 303.00 |
0.9978 times |
Tue 21 October 2025 |
298.30 (3.27%) |
290.80 |
290.25 - 301.00 |
0.3511 times |
Mon 20 October 2025 |
288.85 (-1.63%) |
296.75 |
283.95 - 296.90 |
0.696 times |
Fri 17 October 2025 |
293.65 (0.07%) |
292.65 |
290.00 - 308.10 |
1.9876 times |
Thu 16 October 2025 |
293.45 (0.79%) |
293.05 |
289.10 - 301.75 |
1.3825 times |
Wed 15 October 2025 |
291.15 (-3.29%) |
300.95 |
288.05 - 300.95 |
1.3569 times |
Tue 14 October 2025 |
301.05 (-5%) |
319.00 |
301.05 - 322.25 |
1.1747 times |
Mon 13 October 2025 |
316.90 (-0.19%) |
324.00 |
314.00 - 332.30 |
1.3669 times |
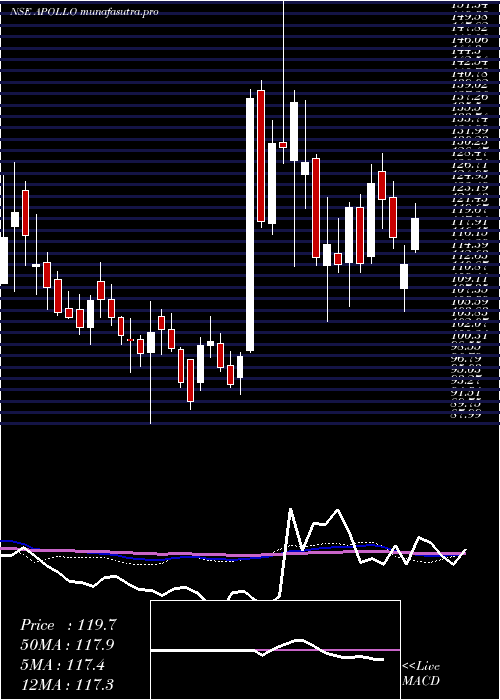
Weekly price and charts ApolloMicro Strong weekly Stock price targets for ApolloMicro APOLLO are 266.2 and 284.9 | Weekly Target 1 | 262.83 | | Weekly Target 2 | 269.57 | | Weekly Target 3 | 281.53333333333 | | Weekly Target 4 | 288.27 | | Weekly Target 5 | 300.23 |
Weekly price and volumes for Apollo Micro
| Date |
Closing |
Open |
Range |
Volume |
Tue 28 October 2025 |
276.30 (-5.1%) |
292.45 |
274.80 - 293.50 |
0.0802 times |
Fri 24 October 2025 |
291.15 (-0.85%) |
296.75 |
283.95 - 303.00 |
0.1664 times |
Fri 17 October 2025 |
293.65 (-7.51%) |
324.00 |
288.05 - 332.30 |
0.4375 times |
Fri 10 October 2025 |
317.50 (-7.37%) |
345.80 |
316.05 - 345.80 |
0.2219 times |
Fri 03 October 2025 |
342.75 (5.58%) |
320.00 |
316.30 - 345.50 |
0.2892 times |
Fri 26 September 2025 |
324.65 (-5.6%) |
343.90 |
320.50 - 349.50 |
0.4487 times |
Fri 19 September 2025 |
343.90 (6.69%) |
325.00 |
318.95 - 354.70 |
1.3812 times |
Fri 12 September 2025 |
322.35 (5.79%) |
303.00 |
268.00 - 326.40 |
1.919 times |
Fri 05 September 2025 |
304.70 (15.95%) |
264.50 |
261.30 - 321.00 |
2.832 times |
Fri 29 August 2025 |
262.79 (11.75%) |
239.00 |
231.20 - 271.40 |
2.2239 times |
Fri 22 August 2025 |
235.16 (23.83%) |
193.00 |
190.85 - 240.40 |
1.7793 times |
Monthly price and charts ApolloMicro Strong monthly Stock price targets for ApolloMicro APOLLO are 240.05 and 311.05 | Monthly Target 1 | 227.97 | | Monthly Target 2 | 252.13 | | Monthly Target 3 | 298.96666666667 | | Monthly Target 4 | 323.13 | | Monthly Target 5 | 369.97 |
Monthly price and volumes Apollo Micro
| Date |
Closing |
Open |
Range |
Volume |
Tue 28 October 2025 |
276.30 (-15.27%) |
325.25 |
274.80 - 345.80 |
0.3009 times |
Tue 30 September 2025 |
326.10 (24.09%) |
264.50 |
261.30 - 354.70 |
1.9417 times |
Fri 29 August 2025 |
262.79 (51.32%) |
173.00 |
168.65 - 271.40 |
1.3547 times |
Thu 31 July 2025 |
173.66 (-9.72%) |
193.25 |
162.34 - 196.00 |
0.4082 times |
Mon 30 June 2025 |
192.36 (1.82%) |
188.70 |
179.10 - 221.38 |
0.7895 times |
Fri 30 May 2025 |
188.92 (60.41%) |
116.81 |
112.60 - 194.00 |
2.3703 times |
Wed 30 April 2025 |
117.77 (-4.03%) |
123.00 |
105.30 - 125.48 |
0.4609 times |
Fri 28 March 2025 |
122.72 (8.91%) |
112.98 |
106.13 - 129.80 |
0.5793 times |
Fri 28 February 2025 |
112.68 (-18.15%) |
126.50 |
103.77 - 138.00 |
0.5473 times |
Fri 31 January 2025 |
137.67 (19.22%) |
117.50 |
112.30 - 157.00 |
1.2471 times |
Tue 31 December 2024 |
115.48 (15.35%) |
100.19 |
92.55 - 117.50 |
0.2889 times |
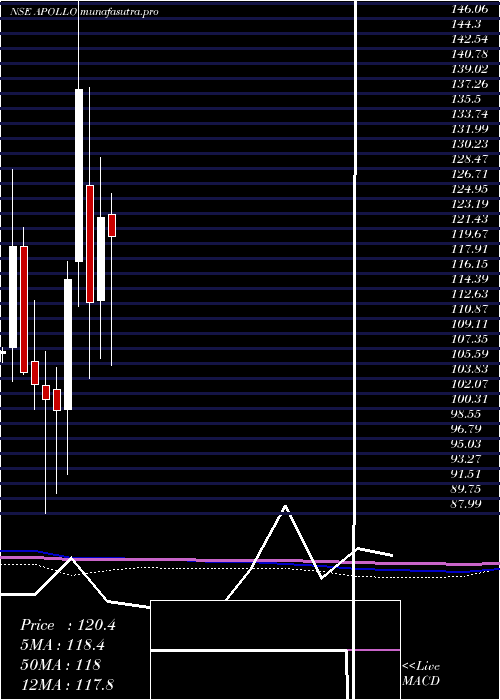
DMA SMA EMA moving averages of Apollo Micro APOLLO
DMA (daily moving average) of Apollo Micro APOLLO
| DMA period | DMA value | | 5 day DMA | 288.1 | | 12 day DMA | 295.25 | | 20 day DMA | 310.18 | | 35 day DMA | 315.27 | | 50 day DMA | 294.84 | | 100 day DMA | 241.03 | | 150 day DMA | 204.91 | | 200 day DMA | 184.39 | EMA (exponential moving average) of Apollo Micro APOLLO
| EMA period | EMA current | EMA prev | EMA prev2 | | 5 day EMA | 285.87 | 290.66 | 293.36 | | 12 day EMA | 295.72 | 299.25 | 301.8 | | 20 day EMA | 300.87 | 303.46 | 305.38 | | 35 day EMA | 293.27 | 294.27 | 294.8 | | 50 day EMA | 284.99 | 285.34 | 285.34 |
SMA (simple moving average) of Apollo Micro APOLLO
| SMA period | SMA current | SMA prev | SMA prev2 | | 5 day SMA | 288.1 | 290.61 | 292.29 | | 12 day SMA | 295.25 | 299.9 | 303.78 | | 20 day SMA | 310.18 | 312.6 | 315.42 | | 35 day SMA | 315.27 | 316.08 | 316.88 | | 50 day SMA | 294.84 | 293.05 | 291.1 | | 100 day SMA | 241.03 | 240.29 | 239.42 | | 150 day SMA | 204.91 | 203.86 | 202.75 | | 200 day SMA | 184.39 | 183.65 | 182.92 |
|
|
