AnthemBiosciences ANTHEM full analysis,charts,indicators,moving averages,SMA,DMA,EMA,ADX,MACD,RSIAnthem Biosciences ANTHEM WideScreen charts, DMA,SMA,EMA technical analysis, forecast prediction, by indicators ADX,MACD,RSI,CCI NSE stock exchange
Daily price and charts and targets AnthemBiosciences Strong Daily Stock price targets for AnthemBiosciences ANTHEM are 700.1 and 724.35 | Daily Target 1 | 695.5 | | Daily Target 2 | 704.7 | | Daily Target 3 | 719.75 | | Daily Target 4 | 728.95 | | Daily Target 5 | 744 |
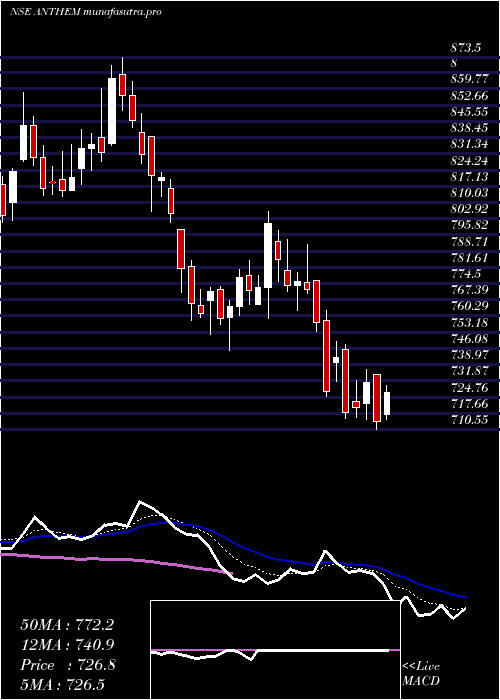
Daily price and volume Anthem Biosciences
| Date |
Closing |
Open |
Range |
Volume |
Tue 28 October 2025 |
713.90 (-2.36%) |
734.80 |
710.55 - 734.80 |
1.6476 times |
Mon 27 October 2025 |
731.15 (1.56%) |
722.05 |
715.05 - 736.70 |
1.0291 times |
Fri 24 October 2025 |
719.95 (0.3%) |
722.75 |
715.90 - 732.25 |
1.8936 times |
Thu 23 October 2025 |
717.80 (-3.28%) |
745.55 |
715.15 - 747.75 |
1.1857 times |
Tue 21 October 2025 |
742.15 (2.07%) |
739.95 |
731.65 - 749.00 |
0.1851 times |
Mon 20 October 2025 |
727.10 (-4.03%) |
758.10 |
725.05 - 762.85 |
1.6407 times |
Fri 17 October 2025 |
757.60 (-1.87%) |
775.80 |
753.45 - 775.80 |
0.4531 times |
Thu 16 October 2025 |
772.05 (-0.45%) |
775.00 |
770.00 - 791.40 |
0.6196 times |
Wed 15 October 2025 |
775.55 (0.24%) |
773.70 |
762.55 - 779.50 |
0.8769 times |
Tue 14 October 2025 |
773.70 (-1.42%) |
780.40 |
771.10 - 794.00 |
0.4685 times |
Mon 13 October 2025 |
784.85 (-1.99%) |
793.00 |
775.20 - 797.60 |
0.6725 times |
Weekly price and charts AnthemBiosciences Strong weekly Stock price targets for AnthemBiosciences ANTHEM are 699.15 and 725.3 | Weekly Target 1 | 694.23 | | Weekly Target 2 | 704.07 | | Weekly Target 3 | 720.38333333333 | | Weekly Target 4 | 730.22 | | Weekly Target 5 | 746.53 |
Weekly price and volumes for Anthem Biosciences
| Date |
Closing |
Open |
Range |
Volume |
Tue 28 October 2025 |
713.90 (-0.84%) |
722.05 |
710.55 - 736.70 |
0.5956 times |
Fri 24 October 2025 |
719.95 (-4.97%) |
758.10 |
715.15 - 762.85 |
1.0914 times |
Fri 17 October 2025 |
757.60 (-5.39%) |
793.00 |
753.45 - 797.60 |
0.6877 times |
Fri 10 October 2025 |
800.80 (5.47%) |
759.65 |
745.05 - 806.00 |
0.8007 times |
Fri 03 October 2025 |
759.25 (-2.77%) |
782.10 |
752.20 - 784.60 |
0.702 times |
Fri 26 September 2025 |
780.90 (-7.71%) |
840.70 |
770.40 - 848.95 |
1.0099 times |
Fri 19 September 2025 |
846.10 (1.51%) |
833.50 |
824.00 - 873.50 |
1.3518 times |
Fri 12 September 2025 |
833.50 (0.45%) |
829.75 |
812.50 - 841.95 |
0.8031 times |
Fri 05 September 2025 |
829.80 (1.44%) |
826.00 |
801.20 - 858.00 |
1.2876 times |
Fri 29 August 2025 |
818.05 (-0.59%) |
828.20 |
815.20 - 864.90 |
1.6702 times |
Fri 22 August 2025 |
822.90 (-0.25%) |
825.00 |
791.20 - 860.80 |
3.9852 times |

Monthly price and charts AnthemBiosciences Strong monthly Stock price targets for AnthemBiosciences ANTHEM are 664.5 and 759.95 | Monthly Target 1 | 648.03 | | Monthly Target 2 | 680.97 | | Monthly Target 3 | 743.48333333333 | | Monthly Target 4 | 776.42 | | Monthly Target 5 | 838.93 |
Monthly price and volumes Anthem Biosciences
| Date |
Closing |
Open |
Range |
Volume |
Tue 28 October 2025 |
713.90 (-6.21%) |
767.05 |
710.55 - 806.00 |
0.2306 times |
Tue 30 September 2025 |
761.20 (-6.95%) |
826.00 |
758.20 - 873.50 |
0.3183 times |
Fri 29 August 2025 |
818.05 (7.76%) |
759.00 |
711.55 - 864.90 |
0.9227 times |
Thu 31 July 2025 |
759.15 (0%) |
723.05 |
701.90 - 801.85 |
2.5285 times |
Tue 28 October 2025 |
(0%) |
|
- |
0 times |

DMA SMA EMA moving averages of Anthem Biosciences ANTHEM
DMA (daily moving average) of Anthem Biosciences ANTHEM
| DMA period | DMA value | | 5 day DMA | 724.99 | | 12 day DMA | 751.38 | | 20 day DMA | 757.98 | | 35 day DMA | 787.39 | | 50 day DMA | 798.88 | | 100 day DMA | | | 150 day DMA | | | 200 day DMA | | EMA (exponential moving average) of Anthem Biosciences ANTHEM
| EMA period | EMA current | EMA prev | EMA prev2 | | 5 day EMA | 726.38 | 732.62 | 733.36 | | 12 day EMA | 743.51 | 748.89 | 752.11 | | 20 day EMA | 757.29 | 761.85 | 765.08 | | 35 day EMA | 772.1 | 775.53 | 778.14 | | 50 day EMA | 787.15 | 790.14 | 792.55 |
SMA (simple moving average) of Anthem Biosciences ANTHEM
| SMA period | SMA current | SMA prev | SMA prev2 | | 5 day SMA | 724.99 | 727.63 | 732.92 | | 12 day SMA | 751.38 | 756.29 | 759.63 | | 20 day SMA | 757.98 | 761.33 | 765.02 | | 35 day SMA | 787.39 | 790.71 | 793.93 | | 50 day SMA | 798.88 | 799.7 | 799.94 | | 100 day SMA | | 150 day SMA | | 200 day SMA |
|
|
