Antarctica ANTGRAPHIC full analysis,charts,indicators,moving averages,SMA,DMA,EMA,ADX,MACD,RSIAntarctica ANTGRAPHIC WideScreen charts, DMA,SMA,EMA technical analysis, forecast prediction, by indicators ADX,MACD,RSI,CCI NSE stock exchange
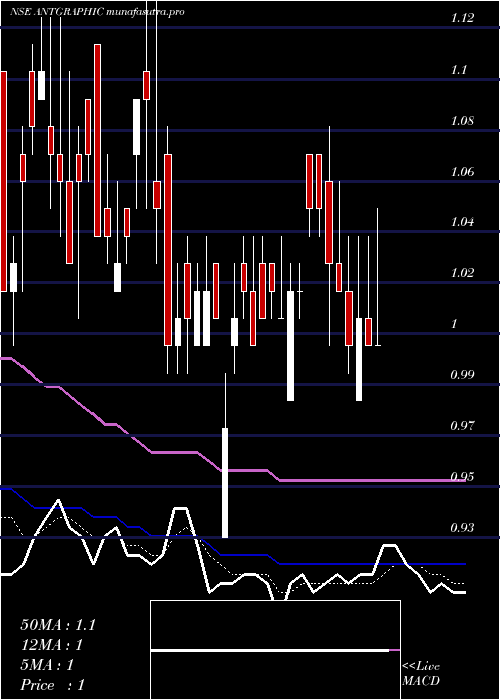
Daily price and charts and targets Antarctica Strong Daily Stock price targets for Antarctica ANTGRAPHIC are 1.06 and 1.08 | Daily Target 1 | 1.05 | | Daily Target 2 | 1.06 | | Daily Target 3 | 1.07 | | Daily Target 4 | 1.08 | | Daily Target 5 | 1.09 |
Daily price and volume Antarctica
| Date |
Closing |
Open |
Range |
Volume |
Tue 28 October 2025 |
1.07 (0.94%) |
1.07 |
1.06 - 1.08 |
1.3772 times |
Mon 27 October 2025 |
1.06 (-0.93%) |
1.07 |
1.05 - 1.08 |
0.8661 times |
Fri 24 October 2025 |
1.07 (0%) |
1.05 |
1.05 - 1.09 |
0.5739 times |
Thu 23 October 2025 |
1.07 (0.94%) |
1.05 |
1.05 - 1.08 |
0.9961 times |
Tue 21 October 2025 |
1.06 (0.95%) |
1.05 |
1.05 - 1.07 |
0.3477 times |
Mon 20 October 2025 |
1.05 (0%) |
1.06 |
1.04 - 1.07 |
0.9772 times |
Fri 17 October 2025 |
1.05 (0%) |
1.05 |
1.05 - 1.09 |
1.4267 times |
Thu 16 October 2025 |
1.05 (0.96%) |
1.06 |
1.05 - 1.07 |
1.002 times |
Wed 15 October 2025 |
1.04 (0%) |
1.04 |
1.04 - 1.06 |
0.878 times |
Tue 14 October 2025 |
1.04 (-2.8%) |
1.06 |
1.04 - 1.08 |
1.555 times |
Mon 13 October 2025 |
1.07 (-1.83%) |
1.09 |
1.06 - 1.09 |
0.8267 times |
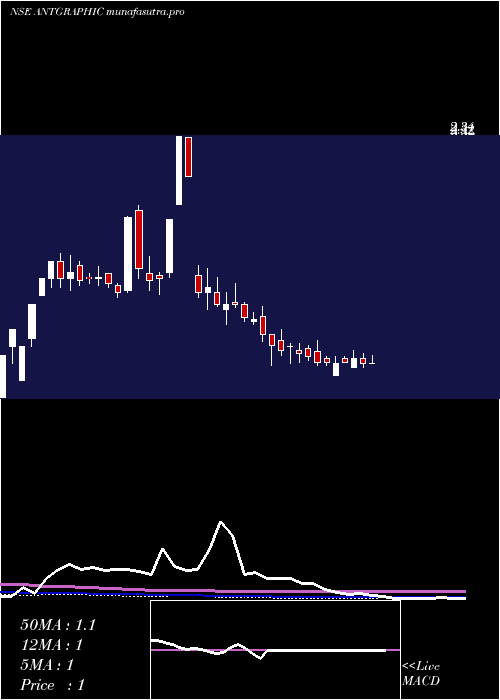
Weekly price and charts Antarctica Strong weekly Stock price targets for Antarctica ANTGRAPHIC are 1.06 and 1.09 | Weekly Target 1 | 1.04 | | Weekly Target 2 | 1.05 | | Weekly Target 3 | 1.0666666666667 | | Weekly Target 4 | 1.08 | | Weekly Target 5 | 1.1 |
Weekly price and volumes for Antarctica
| Date |
Closing |
Open |
Range |
Volume |
Tue 28 October 2025 |
1.07 (0%) |
1.07 |
1.05 - 1.08 |
0.4325 times |
Fri 24 October 2025 |
1.07 (1.9%) |
1.06 |
1.04 - 1.09 |
0.5582 times |
Fri 17 October 2025 |
1.05 (-3.67%) |
1.09 |
1.04 - 1.09 |
1.0968 times |
Fri 10 October 2025 |
1.09 (0.93%) |
1.09 |
0.98 - 1.16 |
1.8429 times |
Fri 03 October 2025 |
1.08 (0.93%) |
1.07 |
1.03 - 1.09 |
0.7076 times |
Fri 26 September 2025 |
1.07 (-3.6%) |
1.11 |
1.07 - 1.12 |
0.8819 times |
Fri 19 September 2025 |
1.11 (3.74%) |
1.07 |
1.05 - 1.16 |
1.1286 times |
Fri 12 September 2025 |
1.07 (-2.73%) |
1.10 |
1.00 - 1.13 |
1.1415 times |
Fri 05 September 2025 |
1.10 (-3.51%) |
1.14 |
1.09 - 1.15 |
1.0189 times |
Fri 29 August 2025 |
1.14 (0%) |
1.12 |
1.05 - 1.22 |
1.1912 times |
Fri 22 August 2025 |
1.14 (0%) |
1.16 |
1.09 - 1.22 |
0.9868 times |
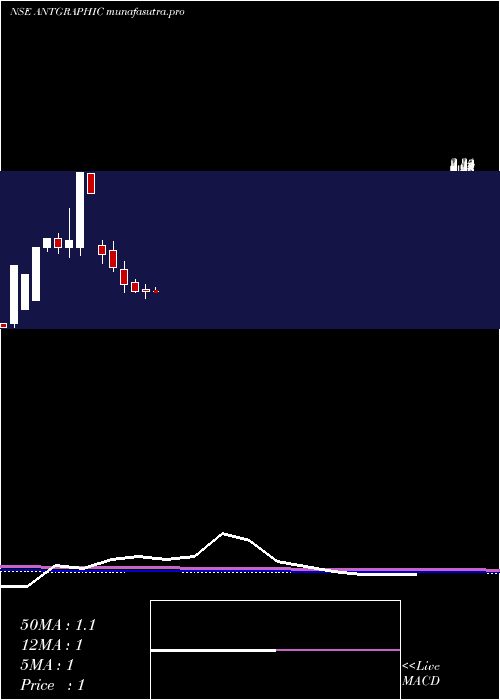
Monthly price and charts Antarctica Strong monthly Stock price targets for Antarctica ANTGRAPHIC are 0.94 and 1.12 | Monthly Target 1 | 0.89 | | Monthly Target 2 | 0.98 | | Monthly Target 3 | 1.07 | | Monthly Target 4 | 1.16 | | Monthly Target 5 | 1.25 |
Monthly price and volumes Antarctica
| Date |
Closing |
Open |
Range |
Volume |
Tue 28 October 2025 |
1.07 (0%) |
1.09 |
0.98 - 1.16 |
0.5076 times |
Tue 30 September 2025 |
1.07 (-6.14%) |
1.14 |
1.00 - 1.16 |
0.5254 times |
Fri 29 August 2025 |
1.14 (-8.06%) |
1.25 |
1.05 - 1.25 |
0.6078 times |
Thu 31 July 2025 |
1.24 (-4.62%) |
1.30 |
1.06 - 1.36 |
1.0223 times |
Mon 30 June 2025 |
1.30 (23.81%) |
1.05 |
1.02 - 1.62 |
3.1599 times |
Fri 30 May 2025 |
1.05 (3.96%) |
1.01 |
0.94 - 1.08 |
0.8419 times |
Wed 30 April 2025 |
1.01 (0%) |
1.03 |
0.93 - 1.08 |
0.626 times |
Fri 28 March 2025 |
1.01 (-6.48%) |
1.10 |
0.99 - 1.14 |
0.8905 times |
Fri 28 February 2025 |
1.08 (-14.96%) |
1.25 |
0.99 - 1.34 |
0.7906 times |
Fri 31 January 2025 |
1.27 (-10.56%) |
1.46 |
1.23 - 1.56 |
1.028 times |
Tue 31 December 2024 |
1.42 (-32.38%) |
1.52 |
1.32 - 1.58 |
1.0155 times |
DMA SMA EMA moving averages of Antarctica ANTGRAPHIC
DMA (daily moving average) of Antarctica ANTGRAPHIC
| DMA period | DMA value | | 5 day DMA | 1.07 | | 12 day DMA | 1.06 | | 20 day DMA | 1.07 | | 35 day DMA | 1.08 | | 50 day DMA | 1.09 | | 100 day DMA | 1.16 | | 150 day DMA | 1.11 | | 200 day DMA | 1.14 | EMA (exponential moving average) of Antarctica ANTGRAPHIC
| EMA period | EMA current | EMA prev | EMA prev2 | | 5 day EMA | 1.06 | 1.06 | 1.06 | | 12 day EMA | 1.07 | 1.07 | 1.07 | | 20 day EMA | 1.09 | 1.09 | 1.09 | | 35 day EMA | 1.11 | 1.11 | 1.11 | | 50 day EMA | 1.1 | 1.1 | 1.1 |
SMA (simple moving average) of Antarctica ANTGRAPHIC
| SMA period | SMA current | SMA prev | SMA prev2 | | 5 day SMA | 1.07 | 1.06 | 1.06 | | 12 day SMA | 1.06 | 1.06 | 1.06 | | 20 day SMA | 1.07 | 1.07 | 1.07 | | 35 day SMA | 1.08 | 1.08 | 1.08 | | 50 day SMA | 1.09 | 1.09 | 1.09 | | 100 day SMA | 1.16 | 1.16 | 1.16 | | 150 day SMA | 1.11 | 1.11 | 1.11 | | 200 day SMA | 1.14 | 1.14 | 1.14 |
|
|
