AnlonTechnology ANLON_SM full analysis,charts,indicators,moving averages,SMA,DMA,EMA,ADX,MACD,RSIAnlon Technology ANLON_SM WideScreen charts, DMA,SMA,EMA technical analysis, forecast prediction, by indicators ADX,MACD,RSI,CCI NSE stock exchange
Daily price and charts and targets AnlonTechnology Strong Daily Stock price targets for AnlonTechnology ANLON_SM are 382.78 and 392.68 | Daily Target 1 | 374.95 | | Daily Target 2 | 380.7 | | Daily Target 3 | 384.85 | | Daily Target 4 | 390.6 | | Daily Target 5 | 394.75 |
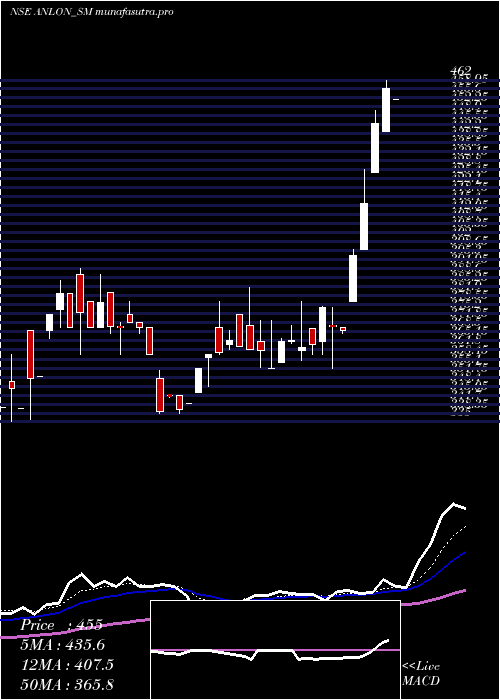
Daily price and volume Anlon Technology
| Date |
Closing |
Open |
Range |
Volume |
Tue 28 October 2025 |
386.45 (-1.02%) |
386.00 |
379.10 - 389.00 |
2.0161 times |
Mon 27 October 2025 |
390.45 (-3.11%) |
395.20 |
386.00 - 399.00 |
0.4839 times |
Fri 24 October 2025 |
403.00 (-0.91%) |
415.00 |
403.00 - 415.00 |
0.3226 times |
Thu 23 October 2025 |
406.70 (5.02%) |
419.95 |
405.00 - 430.00 |
2.5806 times |
Tue 21 October 2025 |
387.25 (-1.95%) |
398.90 |
384.85 - 414.00 |
1.6129 times |
Mon 20 October 2025 |
394.95 (2.97%) |
375.50 |
375.50 - 394.95 |
0.7258 times |
Fri 17 October 2025 |
383.55 (-2.94%) |
381.20 |
381.20 - 397.00 |
1.5323 times |
Thu 16 October 2025 |
395.15 (-1.16%) |
399.80 |
395.15 - 399.80 |
0.1613 times |
Wed 15 October 2025 |
399.80 (-4.34%) |
411.15 |
393.15 - 411.15 |
0.3226 times |
Tue 14 October 2025 |
417.95 (-2.12%) |
423.00 |
416.00 - 423.00 |
0.2419 times |
Mon 13 October 2025 |
427.00 (0%) |
427.00 |
427.00 - 427.00 |
0.0806 times |
Weekly price and charts AnlonTechnology Strong weekly Stock price targets for AnlonTechnology ANLON_SM are 372.83 and 392.73 | Weekly Target 1 | 368.28 | | Weekly Target 2 | 377.37 | | Weekly Target 3 | 388.18333333333 | | Weekly Target 4 | 397.27 | | Weekly Target 5 | 408.08 |
Weekly price and volumes for Anlon Technology
| Date |
Closing |
Open |
Range |
Volume |
Tue 28 October 2025 |
386.45 (-4.11%) |
395.20 |
379.10 - 399.00 |
0.4031 times |
Fri 24 October 2025 |
403.00 (5.07%) |
375.50 |
375.50 - 430.00 |
0.8453 times |
Fri 17 October 2025 |
383.55 (-10.18%) |
427.00 |
381.20 - 427.00 |
0.3771 times |
Wed 08 October 2025 |
427.00 (-6.15%) |
424.00 |
424.00 - 439.00 |
0.2471 times |
Tue 01 July 2025 |
455.00 (1.98%) |
443.00 |
443.00 - 462.00 |
0.3511 times |
Fri 27 June 2025 |
446.15 (18.11%) |
371.00 |
355.10 - 451.00 |
2.4707 times |
Fri 20 June 2025 |
377.75 (6.39%) |
357.00 |
357.00 - 380.00 |
1.6905 times |
Fri 13 June 2025 |
355.05 (-1.59%) |
364.00 |
355.00 - 385.00 |
1.5605 times |
Fri 06 June 2025 |
360.80 (4.63%) |
345.00 |
338.00 - 380.00 |
1.0793 times |
Fri 30 May 2025 |
344.85 (-6.8%) |
375.00 |
338.00 - 379.90 |
0.9753 times |
Fri 23 May 2025 |
370.00 (0%) |
390.00 |
360.00 - 392.00 |
1.3524 times |
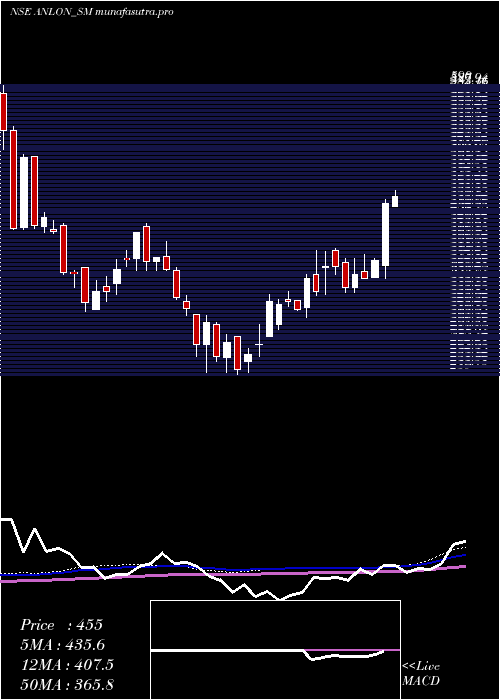
Monthly price and charts AnlonTechnology Strong monthly Stock price targets for AnlonTechnology ANLON_SM are 349.23 and 412.73 | Monthly Target 1 | 336.82 | | Monthly Target 2 | 361.63 | | Monthly Target 3 | 400.31666666667 | | Monthly Target 4 | 425.13 | | Monthly Target 5 | 463.82 |
Monthly price and volumes Anlon Technology
| Date |
Closing |
Open |
Range |
Volume |
Tue 28 October 2025 |
386.45 (-15.07%) |
424.00 |
375.50 - 439.00 |
0.2834 times |
Tue 01 July 2025 |
455.00 (-0.87%) |
455.00 |
455.00 - 455.00 |
0.0118 times |
Mon 30 June 2025 |
459.00 (33.1%) |
345.00 |
338.00 - 462.00 |
1.0707 times |
Fri 30 May 2025 |
344.85 (11.21%) |
314.00 |
314.00 - 392.00 |
0.6259 times |
Wed 30 April 2025 |
310.10 (12.7%) |
284.90 |
284.90 - 340.00 |
0.309 times |
Fri 28 March 2025 |
275.15 (5.62%) |
259.00 |
239.00 - 299.00 |
2.718 times |
Fri 28 February 2025 |
260.50 (-21.68%) |
327.00 |
241.50 - 334.90 |
0.8502 times |
Fri 31 January 2025 |
332.60 (-10.11%) |
365.05 |
330.00 - 421.85 |
1.0431 times |
Tue 31 December 2024 |
370.00 (13.5%) |
318.00 |
318.00 - 389.50 |
1.6217 times |
Fri 29 November 2024 |
326.00 (-23.11%) |
435.00 |
315.05 - 435.00 |
1.4662 times |
Thu 31 October 2024 |
424.00 (-20.3%) |
419.00 |
411.05 - 505.80 |
1.9071 times |

DMA SMA EMA moving averages of Anlon Technology ANLON_SM
DMA (daily moving average) of Anlon Technology ANLON_SM
| DMA period | DMA value | | 5 day DMA | 394.77 | | 12 day DMA | 401.6 | | 20 day DMA | 410.75 | | 35 day DMA | 389.85 | | 50 day DMA | 382.32 | | 100 day DMA | 340.3 | | 150 day DMA | 344.13 | | 200 day DMA | 362.67 | EMA (exponential moving average) of Anlon Technology ANLON_SM
| EMA period | EMA current | EMA prev | EMA prev2 | | 5 day EMA | 393.48 | 397 | 400.27 | | 12 day EMA | 398.93 | 401.2 | 403.15 | | 20 day EMA | 398.61 | 399.89 | 400.88 | | 35 day EMA | 392.37 | 392.72 | 392.85 | | 50 day EMA | 380.62 | 380.38 | 379.97 |
SMA (simple moving average) of Anlon Technology ANLON_SM
| SMA period | SMA current | SMA prev | SMA prev2 | | 5 day SMA | 394.77 | 396.47 | 395.09 | | 12 day SMA | 401.6 | 405.19 | 407.98 | | 20 day SMA | 410.75 | 409.95 | 409.31 | | 35 day SMA | 389.85 | 388.52 | 387.21 | | 50 day SMA | 382.32 | 381.61 | 380.6 | | 100 day SMA | 340.3 | 338.87 | 337.62 | | 150 day SMA | 344.13 | 343.86 | 343.52 | | 200 day SMA | 362.67 | 363.69 | 364.47 |
|
|
