AnantRaj ANANTRAJ full analysis,charts,indicators,moving averages,SMA,DMA,EMA,ADX,MACD,RSIAnant Raj ANANTRAJ WideScreen charts, DMA,SMA,EMA technical analysis, forecast prediction, by indicators ADX,MACD,RSI,CCI NSE stock exchange
operates under Realty sector
Daily price and charts and targets AnantRaj Strong Daily Stock price targets for AnantRaj ANANTRAJ are 494.33 and 524.28 | Daily Target 1 | 470.92 | | Daily Target 2 | 487.78 | | Daily Target 3 | 500.86666666667 | | Daily Target 4 | 517.73 | | Daily Target 5 | 530.82 |
Daily price and volume Anant Raj
| Date |
Closing |
Open |
Range |
Volume |
Tue 09 December 2025 |
504.65 (0.3%) |
503.10 |
484.00 - 513.95 |
1.8342 times |
Mon 08 December 2025 |
503.15 (-4.4%) |
526.70 |
498.10 - 532.00 |
1.2473 times |
Fri 05 December 2025 |
526.30 (-2.6%) |
540.75 |
525.00 - 544.75 |
0.7405 times |
Thu 04 December 2025 |
540.35 (-2.35%) |
553.00 |
539.50 - 553.00 |
0.5069 times |
Wed 03 December 2025 |
553.35 (-0.42%) |
556.00 |
547.15 - 566.80 |
0.6144 times |
Tue 02 December 2025 |
555.70 (-2.97%) |
571.50 |
554.00 - 571.50 |
0.6324 times |
Mon 01 December 2025 |
572.70 (-0.65%) |
579.10 |
570.90 - 583.50 |
0.5165 times |
Fri 28 November 2025 |
576.45 (-1.89%) |
587.00 |
574.00 - 587.00 |
0.5988 times |
Thu 27 November 2025 |
587.55 (-2.9%) |
609.00 |
585.00 - 609.00 |
0.7119 times |
Wed 26 November 2025 |
605.10 (1.8%) |
594.35 |
590.05 - 615.00 |
2.5972 times |
Tue 25 November 2025 |
594.40 (4.14%) |
574.85 |
571.60 - 596.75 |
1.3159 times |
Weekly price and charts AnantRaj Strong weekly Stock price targets for AnantRaj ANANTRAJ are 470.33 and 518.33 | Weekly Target 1 | 458.88 | | Weekly Target 2 | 481.77 | | Weekly Target 3 | 506.88333333333 | | Weekly Target 4 | 529.77 | | Weekly Target 5 | 554.88 |
Weekly price and volumes for Anant Raj
| Date |
Closing |
Open |
Range |
Volume |
Tue 09 December 2025 |
504.65 (-4.11%) |
526.70 |
484.00 - 532.00 |
0.5682 times |
Fri 05 December 2025 |
526.30 (-8.7%) |
579.10 |
525.00 - 583.50 |
0.5552 times |
Fri 28 November 2025 |
576.45 (-5.57%) |
611.70 |
566.35 - 616.80 |
1.1713 times |
Fri 21 November 2025 |
610.45 (-0.92%) |
626.70 |
608.20 - 642.95 |
0.606 times |
Fri 14 November 2025 |
616.10 (-0.6%) |
635.10 |
611.25 - 643.40 |
0.661 times |
Fri 07 November 2025 |
619.85 (-3.81%) |
644.00 |
601.65 - 657.25 |
0.5739 times |
Fri 31 October 2025 |
644.40 (4.36%) |
618.00 |
615.05 - 654.00 |
0.9162 times |
Fri 24 October 2025 |
617.45 (-0.57%) |
625.00 |
615.65 - 647.90 |
0.7158 times |
Fri 17 October 2025 |
621.00 (-10.54%) |
691.45 |
619.00 - 700.00 |
1.9256 times |
Fri 10 October 2025 |
694.20 (-3.56%) |
721.00 |
686.35 - 743.65 |
2.3068 times |
Fri 03 October 2025 |
719.80 (5.9%) |
696.00 |
684.20 - 731.70 |
2.6647 times |

Monthly price and charts AnantRaj Strong monthly Stock price targets for AnantRaj ANANTRAJ are 444.58 and 544.08 | Monthly Target 1 | 424.55 | | Monthly Target 2 | 464.6 | | Monthly Target 3 | 524.05 | | Monthly Target 4 | 564.1 | | Monthly Target 5 | 623.55 |
Monthly price and volumes Anant Raj
| Date |
Closing |
Open |
Range |
Volume |
Tue 09 December 2025 |
504.65 (-12.46%) |
579.10 |
484.00 - 583.50 |
0.2536 times |
Fri 28 November 2025 |
576.45 (-10.54%) |
644.00 |
566.35 - 657.25 |
0.6799 times |
Fri 31 October 2025 |
644.40 (-7.7%) |
698.00 |
615.05 - 743.65 |
1.5605 times |
Tue 30 September 2025 |
698.15 (35.21%) |
518.40 |
515.55 - 719.90 |
2.8876 times |
Fri 29 August 2025 |
516.35 (-8.55%) |
562.90 |
511.30 - 573.60 |
0.2898 times |
Thu 31 July 2025 |
564.60 (-0.33%) |
570.00 |
533.75 - 620.00 |
1.0673 times |
Mon 30 June 2025 |
566.45 (0.94%) |
565.20 |
503.55 - 604.20 |
0.8521 times |
Fri 30 May 2025 |
561.20 (24.19%) |
452.00 |
414.05 - 569.00 |
0.8417 times |
Wed 30 April 2025 |
451.90 (-8.08%) |
486.65 |
376.15 - 525.00 |
0.8703 times |
Fri 28 March 2025 |
491.60 (6.12%) |
467.25 |
418.75 - 558.05 |
0.6973 times |
Fri 28 February 2025 |
463.25 (-22.57%) |
635.00 |
454.25 - 639.00 |
0.7559 times |

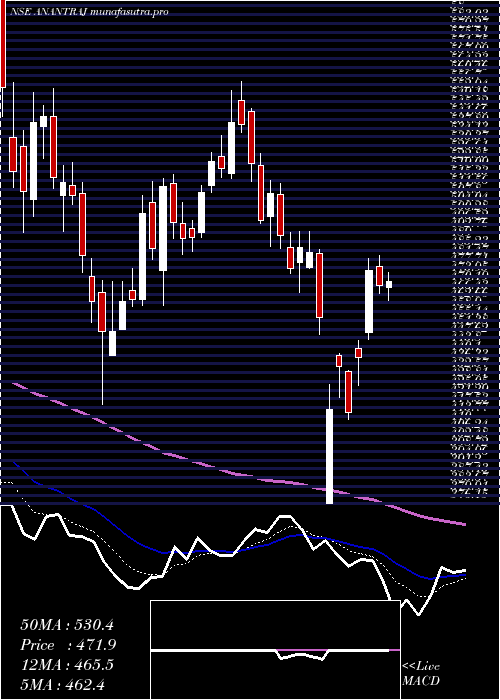
DMA SMA EMA moving averages of Anant Raj ANANTRAJ
DMA (daily moving average) of Anant Raj ANANTRAJ
| DMA period | DMA value | | 5 day DMA | 525.56 | | 12 day DMA | 557.54 | | 20 day DMA | 582.17 | | 35 day DMA | 603.67 | | 50 day DMA | 628.34 | | 100 day DMA | 596.48 | | 150 day DMA | 575.86 | | 200 day DMA | 553.2 | EMA (exponential moving average) of Anant Raj ANANTRAJ
| EMA period | EMA current | EMA prev | EMA prev2 | | 5 day EMA | 523.48 | 532.9 | 547.77 | | 12 day EMA | 551.52 | 560.04 | 570.38 | | 20 day EMA | 571.9 | 578.98 | 586.96 | | 35 day EMA | 598.71 | 604.25 | 610.2 | | 50 day EMA | 621.17 | 625.92 | 630.93 |
SMA (simple moving average) of Anant Raj ANANTRAJ
| SMA period | SMA current | SMA prev | SMA prev2 | | 5 day SMA | 525.56 | 535.77 | 549.68 | | 12 day SMA | 557.54 | 566.35 | 575.99 | | 20 day SMA | 582.17 | 587.68 | 593.91 | | 35 day SMA | 603.67 | 606.99 | 610.71 | | 50 day SMA | 628.34 | 631.81 | 635.29 | | 100 day SMA | 596.48 | 597.5 | 598.19 | | 150 day SMA | 575.86 | 575.45 | 575.17 | | 200 day SMA | 553.2 | 553.45 | 553.92 |
|
|
