AmjLand AMJLAND full analysis,charts,indicators,moving averages,SMA,DMA,EMA,ADX,MACD,RSIAmj Land AMJLAND WideScreen charts, DMA,SMA,EMA technical analysis, forecast prediction, by indicators ADX,MACD,RSI,CCI NSE stock exchange
Daily price and charts and targets AmjLand Strong Daily Stock price targets for AmjLand AMJLAND are 54.39 and 56.67 | Daily Target 1 | 53.87 | | Daily Target 2 | 54.91 | | Daily Target 3 | 56.15 | | Daily Target 4 | 57.19 | | Daily Target 5 | 58.43 |
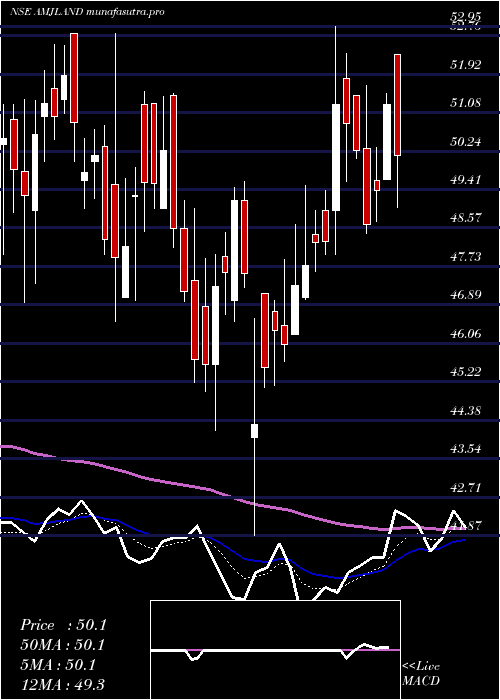
Daily price and volume Amj Land
| Date |
Closing |
Open |
Range |
Volume |
Wed 29 October 2025 |
55.95 (-1.39%) |
56.85 |
55.11 - 57.39 |
1.7111 times |
Tue 28 October 2025 |
56.74 (2.75%) |
56.00 |
55.01 - 57.00 |
1.6008 times |
Mon 27 October 2025 |
55.22 (2.3%) |
54.90 |
54.20 - 56.09 |
2.3421 times |
Fri 24 October 2025 |
53.98 (-0.11%) |
54.10 |
53.52 - 54.58 |
1.1857 times |
Thu 23 October 2025 |
54.04 (-0.41%) |
54.26 |
54.00 - 54.78 |
0.6661 times |
Tue 21 October 2025 |
54.26 (1.84%) |
53.90 |
53.55 - 55.00 |
0.2286 times |
Mon 20 October 2025 |
53.28 (0.06%) |
53.25 |
53.01 - 54.10 |
0.3724 times |
Fri 17 October 2025 |
53.25 (-0.75%) |
53.69 |
53.00 - 54.47 |
0.3976 times |
Thu 16 October 2025 |
53.65 (-0.52%) |
54.89 |
53.31 - 55.30 |
1.0413 times |
Wed 15 October 2025 |
53.93 (-0.53%) |
54.90 |
53.11 - 54.90 |
0.4543 times |
Tue 14 October 2025 |
54.22 (-0.09%) |
55.37 |
53.90 - 55.75 |
1.0052 times |
Weekly price and charts AmjLand Strong weekly Stock price targets for AmjLand AMJLAND are 55.08 and 58.27 | Weekly Target 1 | 52.66 | | Weekly Target 2 | 54.3 | | Weekly Target 3 | 55.846666666667 | | Weekly Target 4 | 57.49 | | Weekly Target 5 | 59.04 |
Weekly price and volumes for Amj Land
| Date |
Closing |
Open |
Range |
Volume |
Wed 29 October 2025 |
55.95 (3.65%) |
54.90 |
54.20 - 57.39 |
1.1521 times |
Fri 24 October 2025 |
53.98 (1.37%) |
53.25 |
53.01 - 55.00 |
0.4998 times |
Fri 17 October 2025 |
53.25 (-1.35%) |
53.00 |
53.00 - 55.80 |
0.7245 times |
Fri 10 October 2025 |
53.98 (-2.74%) |
55.40 |
52.00 - 55.94 |
1.0052 times |
Fri 03 October 2025 |
55.50 (3.22%) |
53.70 |
53.05 - 56.00 |
0.6431 times |
Fri 26 September 2025 |
53.77 (-6.05%) |
57.22 |
53.00 - 57.70 |
1.2542 times |
Fri 19 September 2025 |
57.23 (1.62%) |
56.11 |
55.34 - 57.80 |
1.2682 times |
Fri 12 September 2025 |
56.32 (-0.97%) |
59.10 |
55.78 - 61.00 |
1.3057 times |
Fri 05 September 2025 |
56.87 (-0.23%) |
57.80 |
56.02 - 58.88 |
1.1849 times |
Fri 29 August 2025 |
57.00 (0.19%) |
57.40 |
55.10 - 58.70 |
0.9623 times |
Fri 22 August 2025 |
56.89 (7.04%) |
54.10 |
54.10 - 57.50 |
1.4736 times |

Monthly price and charts AmjLand Strong monthly Stock price targets for AmjLand AMJLAND are 53.98 and 59.37 | Monthly Target 1 | 49.72 | | Monthly Target 2 | 52.84 | | Monthly Target 3 | 55.113333333333 | | Monthly Target 4 | 58.23 | | Monthly Target 5 | 60.5 |
Monthly price and volumes Amj Land
| Date |
Closing |
Open |
Range |
Volume |
Wed 29 October 2025 |
55.95 (3.44%) |
54.64 |
52.00 - 57.39 |
0.3403 times |
Tue 30 September 2025 |
54.09 (-5.11%) |
57.80 |
53.00 - 61.00 |
0.4892 times |
Fri 29 August 2025 |
57.00 (-5.33%) |
60.50 |
52.71 - 62.25 |
0.6707 times |
Thu 31 July 2025 |
60.21 (-8.5%) |
65.99 |
56.05 - 66.79 |
0.8422 times |
Mon 30 June 2025 |
65.80 (15.24%) |
58.00 |
56.35 - 68.90 |
3.0279 times |
Fri 30 May 2025 |
57.10 (13.88%) |
51.00 |
44.10 - 62.00 |
1.4634 times |
Wed 30 April 2025 |
50.14 (9.98%) |
45.59 |
41.87 - 52.95 |
0.6003 times |
Fri 28 March 2025 |
45.59 (-8.53%) |
49.80 |
45.00 - 52.80 |
0.5776 times |
Fri 28 February 2025 |
49.84 (-12.13%) |
56.25 |
47.05 - 60.55 |
0.6136 times |
Fri 31 January 2025 |
56.72 (-14.96%) |
67.00 |
50.51 - 70.81 |
1.3749 times |
Tue 31 December 2024 |
66.70 (2.24%) |
65.24 |
60.25 - 76.49 |
4.8549 times |

DMA SMA EMA moving averages of Amj Land AMJLAND
DMA (daily moving average) of Amj Land AMJLAND
| DMA period | DMA value | | 5 day DMA | 55.19 | | 12 day DMA | 54.4 | | 20 day DMA | 54.36 | | 35 day DMA | 55.02 | | 50 day DMA | 55.59 | | 100 day DMA | 58.4 | | 150 day DMA | 56.02 | | 200 day DMA | 55.42 | EMA (exponential moving average) of Amj Land AMJLAND
| EMA period | EMA current | EMA prev | EMA prev2 | | 5 day EMA | 55.42 | 55.15 | 54.35 | | 12 day EMA | 54.8 | 54.59 | 54.2 | | 20 day EMA | 54.75 | 54.62 | 54.4 | | 35 day EMA | 54.98 | 54.92 | 54.81 | | 50 day EMA | 55.44 | 55.42 | 55.37 |
SMA (simple moving average) of Amj Land AMJLAND
| SMA period | SMA current | SMA prev | SMA prev2 | | 5 day SMA | 55.19 | 54.85 | 54.16 | | 12 day SMA | 54.4 | 54.24 | 54.07 | | 20 day SMA | 54.36 | 54.23 | 54.08 | | 35 day SMA | 55.02 | 55.04 | 55.04 | | 50 day SMA | 55.59 | 55.53 | 55.47 | | 100 day SMA | 58.4 | 58.45 | 58.49 | | 150 day SMA | 56.02 | 55.97 | 55.93 | | 200 day SMA | 55.42 | 55.46 | 55.49 |
|
|
