AnbMetal AMCL_ST full analysis,charts,indicators,moving averages,SMA,DMA,EMA,ADX,MACD,RSIAnb Metal AMCL_ST WideScreen charts, DMA,SMA,EMA technical analysis, forecast prediction, by indicators ADX,MACD,RSI,CCI NSE stock exchange
Daily price and charts and targets AnbMetal Strong Daily Stock price targets for AnbMetal AMCL_ST are 293 and 307 | Daily Target 1 | 281.33 | | Daily Target 2 | 290.67 | | Daily Target 3 | 295.33333333333 | | Daily Target 4 | 304.67 | | Daily Target 5 | 309.33 |
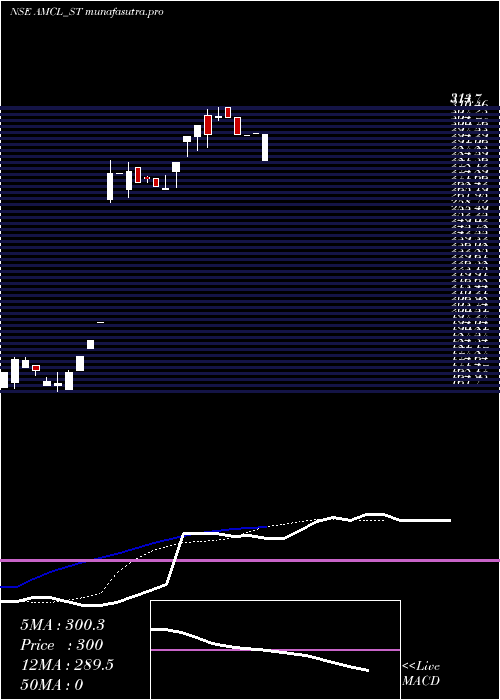
Daily price and volume Anb Metal
| Date |
Closing |
Open |
Range |
Volume |
Tue 28 October 2025 |
300.00 (-0.15%) |
286.05 |
286.00 - 300.00 |
0.2389 times |
Mon 27 October 2025 |
300.45 (0.48%) |
300.45 |
300.10 - 300.45 |
0.1024 times |
Fri 24 October 2025 |
299.00 (-0.33%) |
299.00 |
299.00 - 299.00 |
0.0341 times |
Thu 23 October 2025 |
300.00 (-2.91%) |
309.00 |
300.00 - 309.00 |
0.1706 times |
Tue 21 October 2025 |
309.00 (-0.05%) |
314.00 |
309.00 - 314.00 |
0.0683 times |
Mon 20 October 2025 |
309.15 (3.05%) |
309.00 |
307.00 - 314.00 |
1.1945 times |
Fri 17 October 2025 |
300.00 (-1.45%) |
309.90 |
293.00 - 313.00 |
2.4232 times |
Thu 16 October 2025 |
304.40 (1.89%) |
298.70 |
291.00 - 304.40 |
0.4778 times |
Wed 15 October 2025 |
298.75 (4.99%) |
296.00 |
288.00 - 298.75 |
2.6621 times |
Tue 14 October 2025 |
284.55 (5%) |
279.85 |
271.10 - 284.55 |
2.628 times |
Mon 13 October 2025 |
271.00 (-0.37%) |
270.00 |
270.00 - 278.00 |
0.5119 times |
Weekly price and charts AnbMetal Strong weekly Stock price targets for AnbMetal AMCL_ST are 285.78 and 300.23 | Weekly Target 1 | 281.03 | | Weekly Target 2 | 290.52 | | Weekly Target 3 | 295.48333333333 | | Weekly Target 4 | 304.97 | | Weekly Target 5 | 309.93 |
Weekly price and volumes for Anb Metal
| Date |
Closing |
Open |
Range |
Volume |
Tue 28 October 2025 |
300.00 (0.33%) |
300.45 |
286.00 - 300.45 |
0.0192 times |
Fri 24 October 2025 |
299.00 (-0.33%) |
309.00 |
299.00 - 314.00 |
0.0825 times |
Fri 17 October 2025 |
300.00 (10.29%) |
270.00 |
270.00 - 313.00 |
0.4892 times |
Fri 10 October 2025 |
272.00 (-2.42%) |
278.75 |
266.00 - 285.00 |
0.046 times |
Fri 03 October 2025 |
278.75 (47.14%) |
198.90 |
198.90 - 286.00 |
0.048 times |
Fri 29 August 2025 |
189.45 (13.31%) |
165.00 |
161.70 - 189.45 |
1.9375 times |
Fri 22 August 2025 |
167.20 (0%) |
164.00 |
163.60 - 180.40 |
4.3776 times |
Wed 29 October 2025 |
(0%) |
|
- |
0 times |

Monthly price and charts AnbMetal Strong monthly Stock price targets for AnbMetal AMCL_ST are 281.63 and 332.38 | Monthly Target 1 | 241.67 | | Monthly Target 2 | 270.83 | | Monthly Target 3 | 292.41666666667 | | Monthly Target 4 | 321.58 | | Monthly Target 5 | 343.17 |
Monthly price and volumes Anb Metal
| Date |
Closing |
Open |
Range |
Volume |
Tue 28 October 2025 |
300.00 (50.83%) |
265.00 |
263.25 - 314.00 |
0.2828 times |
Mon 01 September 2025 |
198.90 (4.99%) |
198.90 |
198.90 - 198.90 |
0.0107 times |
Fri 29 August 2025 |
189.45 (0%) |
164.00 |
161.70 - 189.45 |
2.7065 times |
Wed 29 October 2025 |
(0%) |
|
- |
0 times |

DMA SMA EMA moving averages of Anb Metal AMCL_ST
DMA (daily moving average) of Anb Metal AMCL_ST
| DMA period | DMA value | | 5 day DMA | 301.69 | | 12 day DMA | 295.69 | | 20 day DMA | 275.23 | | 35 day DMA | | | 50 day DMA | | | 100 day DMA | | | 150 day DMA | | | 200 day DMA | | EMA (exponential moving average) of Anb Metal AMCL_ST
| EMA period | EMA current | EMA prev | EMA prev2 | | 5 day EMA | 300.33 | 300.5 | 300.53 | | 12 day EMA | 289.51 | 287.6 | 285.27 | | 20 day EMA | 266.19 | 262.63 | 258.65 | | 35 day EMA | 0 | 0 | 0 | | 50 day EMA | 0 | 0 | 0 |
SMA (simple moving average) of Anb Metal AMCL_ST
| SMA period | SMA current | SMA prev | SMA prev2 | | 5 day SMA | 301.69 | 303.52 | 303.43 | | 12 day SMA | 295.69 | 293.69 | 291.49 | | 20 day SMA | 275.23 | 268.83 | 262.13 | | 35 day SMA | | 50 day SMA | | 100 day SMA | | 150 day SMA | | 200 day SMA |
|
|
