AmbikaCotton AMBIKCO full analysis,charts,indicators,moving averages,SMA,DMA,EMA,ADX,MACD,RSIAmbika Cotton AMBIKCO WideScreen charts, DMA,SMA,EMA technical analysis, forecast prediction, by indicators ADX,MACD,RSI,CCI NSE stock exchange
operates under Textiles sector
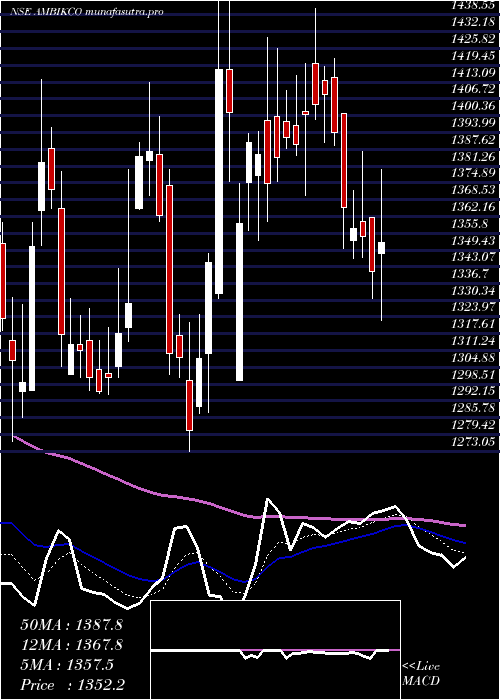
Daily price and charts and targets AmbikaCotton Strong Daily Stock price targets for AmbikaCotton AMBIKCO are 1359.9 and 1386.8 | Daily Target 1 | 1338.67 | | Daily Target 2 | 1354.23 | | Daily Target 3 | 1365.5666666667 | | Daily Target 4 | 1381.13 | | Daily Target 5 | 1392.47 |
Daily price and volume Ambika Cotton
| Date |
Closing |
Open |
Range |
Volume |
Wed 29 October 2025 |
1369.80 (0.85%) |
1359.90 |
1350.00 - 1376.90 |
1.0272 times |
Tue 28 October 2025 |
1358.30 (-0.9%) |
1364.00 |
1354.40 - 1384.80 |
0.8952 times |
Mon 27 October 2025 |
1370.70 (-1.13%) |
1380.50 |
1369.10 - 1410.00 |
0.8993 times |
Fri 24 October 2025 |
1386.30 (-0.52%) |
1393.50 |
1372.60 - 1398.20 |
0.9313 times |
Thu 23 October 2025 |
1393.50 (0.8%) |
1400.00 |
1377.10 - 1438.90 |
2.3614 times |
Tue 21 October 2025 |
1382.40 (1.37%) |
1363.70 |
1356.00 - 1419.60 |
0.5337 times |
Mon 20 October 2025 |
1363.70 (0.13%) |
1375.00 |
1355.00 - 1395.90 |
0.8537 times |
Fri 17 October 2025 |
1361.90 (-1.51%) |
1385.00 |
1338.80 - 1387.60 |
1.2927 times |
Thu 16 October 2025 |
1382.80 (0.21%) |
1376.50 |
1375.00 - 1390.00 |
0.5583 times |
Wed 15 October 2025 |
1379.90 (-0.66%) |
1385.10 |
1376.50 - 1392.00 |
0.6473 times |
Tue 14 October 2025 |
1389.00 (-0.22%) |
1405.50 |
1385.20 - 1405.50 |
0.6262 times |
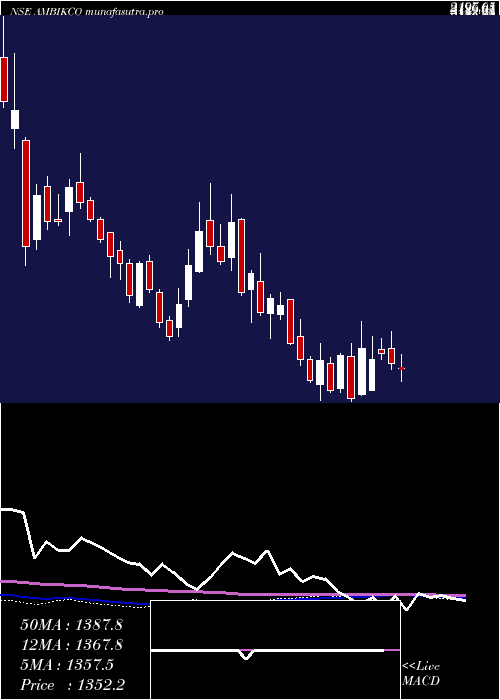
Weekly price and charts AmbikaCotton Strong weekly Stock price targets for AmbikaCotton AMBIKCO are 1329.9 and 1389.9 | Weekly Target 1 | 1316.6 | | Weekly Target 2 | 1343.2 | | Weekly Target 3 | 1376.6 | | Weekly Target 4 | 1403.2 | | Weekly Target 5 | 1436.6 |
Weekly price and volumes for Ambika Cotton
| Date |
Closing |
Open |
Range |
Volume |
Wed 29 October 2025 |
1369.80 (-1.19%) |
1380.50 |
1350.00 - 1410.00 |
0.5366 times |
Fri 24 October 2025 |
1386.30 (1.79%) |
1375.00 |
1355.00 - 1438.90 |
0.89 times |
Fri 17 October 2025 |
1361.90 (-3.55%) |
1412.10 |
1338.80 - 1414.30 |
0.7402 times |
Fri 10 October 2025 |
1412.10 (-1.07%) |
1410.30 |
1400.10 - 1426.40 |
0.4247 times |
Fri 03 October 2025 |
1427.40 (0.47%) |
1405.00 |
1395.00 - 1454.90 |
0.5709 times |
Fri 26 September 2025 |
1420.70 (-6.52%) |
1500.00 |
1410.00 - 1508.90 |
1.0258 times |
Fri 19 September 2025 |
1519.80 (0.7%) |
1522.10 |
1510.00 - 1599.00 |
2.7141 times |
Fri 12 September 2025 |
1509.20 (2.85%) |
1467.90 |
1452.10 - 1527.00 |
0.8673 times |
Fri 05 September 2025 |
1467.40 (4.24%) |
1407.70 |
1390.00 - 1527.00 |
0.9154 times |
Fri 29 August 2025 |
1407.70 (-4.77%) |
1465.00 |
1363.10 - 1467.70 |
1.3151 times |
Fri 22 August 2025 |
1478.20 (4.9%) |
1408.10 |
1408.10 - 1544.00 |
1.8992 times |
Monthly price and charts AmbikaCotton Strong monthly Stock price targets for AmbikaCotton AMBIKCO are 1296.25 and 1412.35 | Monthly Target 1 | 1271.73 | | Monthly Target 2 | 1320.77 | | Monthly Target 3 | 1387.8333333333 | | Monthly Target 4 | 1436.87 | | Monthly Target 5 | 1503.93 |
Monthly price and volumes Ambika Cotton
| Date |
Closing |
Open |
Range |
Volume |
Wed 29 October 2025 |
1369.80 (-3.33%) |
1412.60 |
1338.80 - 1454.90 |
0.4871 times |
Tue 30 September 2025 |
1417.00 (0.66%) |
1407.70 |
1390.00 - 1599.00 |
0.9533 times |
Fri 29 August 2025 |
1407.70 (-9.66%) |
1547.10 |
1363.10 - 1565.00 |
0.9288 times |
Thu 31 July 2025 |
1558.20 (-1.75%) |
1587.00 |
1550.00 - 1675.80 |
0.79 times |
Mon 30 June 2025 |
1585.90 (6.41%) |
1488.00 |
1475.00 - 1700.00 |
1.0194 times |
Fri 30 May 2025 |
1490.30 (11.11%) |
1348.00 |
1322.70 - 1599.00 |
1.2842 times |
Wed 30 April 2025 |
1341.30 (4.71%) |
1290.20 |
1287.45 - 1467.00 |
1.0947 times |
Fri 28 March 2025 |
1281.00 (-3.21%) |
1315.20 |
1273.05 - 1414.05 |
1.4837 times |
Fri 28 February 2025 |
1323.45 (-13.06%) |
1484.00 |
1319.00 - 1536.05 |
0.8809 times |
Fri 31 January 2025 |
1522.25 (-5.95%) |
1627.00 |
1425.00 - 1769.90 |
1.078 times |
Tue 31 December 2024 |
1618.60 (7.49%) |
1519.90 |
1502.05 - 1797.00 |
1.8717 times |
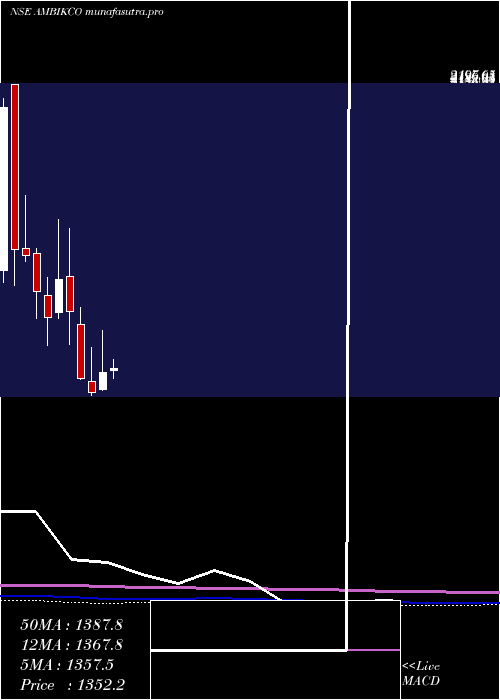
DMA SMA EMA moving averages of Ambika Cotton AMBIKCO
DMA (daily moving average) of Ambika Cotton AMBIKCO
| DMA period | DMA value | | 5 day DMA | 1375.72 | | 12 day DMA | 1377.53 | | 20 day DMA | 1392.63 | | 35 day DMA | 1434.93 | | 50 day DMA | 1439.45 | | 100 day DMA | 1499.66 | | 150 day DMA | 1477.33 | | 200 day DMA | 1466.91 | EMA (exponential moving average) of Ambika Cotton AMBIKCO
| EMA period | EMA current | EMA prev | EMA prev2 | | 5 day EMA | 1371.57 | 1372.45 | 1379.52 | | 12 day EMA | 1381.66 | 1383.82 | 1388.46 | | 20 day EMA | 1394.87 | 1397.51 | 1401.64 | | 35 day EMA | 1410.94 | 1413.36 | 1416.6 | | 50 day EMA | 1430.97 | 1433.47 | 1436.54 |
SMA (simple moving average) of Ambika Cotton AMBIKCO
| SMA period | SMA current | SMA prev | SMA prev2 | | 5 day SMA | 1375.72 | 1378.24 | 1379.32 | | 12 day SMA | 1377.53 | 1381.05 | 1384.91 | | 20 day SMA | 1392.63 | 1394.19 | 1397.31 | | 35 day SMA | 1434.93 | 1438.17 | 1441.29 | | 50 day SMA | 1439.45 | 1440.23 | 1441.29 | | 100 day SMA | 1499.66 | 1502.87 | 1505.64 | | 150 day SMA | 1477.33 | 1477.06 | 1476.79 | | 200 day SMA | 1466.91 | 1468.09 | 1469.31 |
|
|
