AmantaHealthcare AMANTA full analysis,charts,indicators,moving averages,SMA,DMA,EMA,ADX,MACD,RSIAmanta Healthcare AMANTA WideScreen charts, DMA,SMA,EMA technical analysis, forecast prediction, by indicators ADX,MACD,RSI,CCI NSE stock exchange
Daily price and charts and targets AmantaHealthcare Strong Daily Stock price targets for AmantaHealthcare AMANTA are 118.63 and 123.37 | Daily Target 1 | 117.34 | | Daily Target 2 | 119.92 | | Daily Target 3 | 122.08 | | Daily Target 4 | 124.66 | | Daily Target 5 | 126.82 |
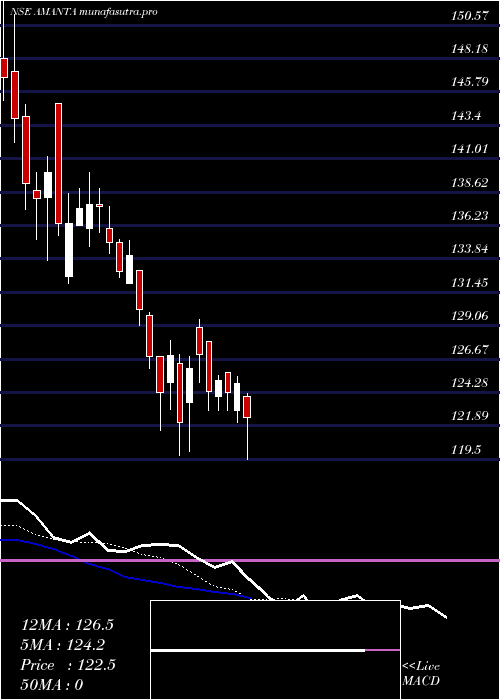
Daily price and volume Amanta Healthcare
| Date |
Closing |
Open |
Range |
Volume |
Wed 29 October 2025 |
122.50 (-1.94%) |
124.00 |
119.50 - 124.24 |
1.7996 times |
Tue 28 October 2025 |
124.92 (0.53%) |
123.00 |
122.10 - 125.45 |
0.5597 times |
Mon 27 October 2025 |
124.26 (-0.67%) |
125.68 |
123.02 - 125.68 |
0.4553 times |
Fri 24 October 2025 |
125.10 (0.6%) |
124.00 |
123.00 - 125.50 |
0.5295 times |
Thu 23 October 2025 |
124.36 (-2.09%) |
127.95 |
123.01 - 127.95 |
0.4357 times |
Tue 21 October 2025 |
127.02 (0.81%) |
128.90 |
125.00 - 129.49 |
0.5678 times |
Mon 20 October 2025 |
126.00 (3.17%) |
123.59 |
120.06 - 126.85 |
0.9485 times |
Fri 17 October 2025 |
122.13 (-3.8%) |
126.35 |
119.79 - 126.99 |
1.0708 times |
Thu 16 October 2025 |
126.96 (2.13%) |
125.00 |
123.06 - 128.00 |
0.5678 times |
Wed 15 October 2025 |
124.31 (-2.01%) |
126.86 |
121.54 - 126.86 |
3.0653 times |
Tue 14 October 2025 |
126.86 (-2.6%) |
129.80 |
126.00 - 130.00 |
0.8695 times |
Weekly price and charts AmantaHealthcare Strong weekly Stock price targets for AmantaHealthcare AMANTA are 117.91 and 124.09 | Weekly Target 1 | 116.38 | | Weekly Target 2 | 119.44 | | Weekly Target 3 | 122.56 | | Weekly Target 4 | 125.62 | | Weekly Target 5 | 128.74 |
Weekly price and volumes for Amanta Healthcare
| Date |
Closing |
Open |
Range |
Volume |
Wed 29 October 2025 |
122.50 (-2.08%) |
125.68 |
119.50 - 125.68 |
0.4803 times |
Fri 24 October 2025 |
125.10 (2.43%) |
123.59 |
120.06 - 129.49 |
0.4235 times |
Fri 17 October 2025 |
122.13 (-8.9%) |
133.00 |
119.79 - 133.00 |
1.113 times |
Fri 10 October 2025 |
134.06 (-2.47%) |
136.05 |
132.10 - 140.00 |
1.0808 times |
Fri 03 October 2025 |
137.45 (0%) |
138.20 |
132.10 - 144.99 |
1.9024 times |
Wed 29 October 2025 |
(0%) |
|
- |
0 times |

Monthly price and charts AmantaHealthcare Strong monthly Stock price targets for AmantaHealthcare AMANTA are 110.75 and 131.25 | Monthly Target 1 | 106.83 | | Monthly Target 2 | 114.67 | | Monthly Target 3 | 127.33333333333 | | Monthly Target 4 | 135.17 | | Monthly Target 5 | 147.83 |
Monthly price and volumes Amanta Healthcare
| Date |
Closing |
Open |
Range |
Volume |
Wed 29 October 2025 |
122.50 (-10.16%) |
132.60 |
119.50 - 140.00 |
0.8128 times |
Tue 30 September 2025 |
136.36 (0%) |
148.15 |
133.71 - 154.40 |
1.1872 times |
Wed 29 October 2025 |
(0%) |
|
- |
0 times |

DMA SMA EMA moving averages of Amanta Healthcare AMANTA
DMA (daily moving average) of Amanta Healthcare AMANTA
| DMA period | DMA value | | 5 day DMA | 124.23 | | 12 day DMA | 125.39 | | 20 day DMA | 129.61 | | 35 day DMA | | | 50 day DMA | | | 100 day DMA | | | 150 day DMA | | | 200 day DMA | | EMA (exponential moving average) of Amanta Healthcare AMANTA
| EMA period | EMA current | EMA prev | EMA prev2 | | 5 day EMA | 124.2 | 125.05 | 125.11 | | 12 day EMA | 126.49 | 127.22 | 127.64 | | 20 day EMA | 130.1 | 130.9 | 131.53 | | 35 day EMA | 0 | 0 | 0 | | 50 day EMA | 0 | 0 | 0 |
SMA (simple moving average) of Amanta Healthcare AMANTA
| SMA period | SMA current | SMA prev | SMA prev2 | | 5 day SMA | 124.23 | 125.13 | 125.35 | | 12 day SMA | 125.39 | 126.35 | 127.02 | | 20 day SMA | 129.61 | 130.48 | 131.15 | | 35 day SMA | | 50 day SMA | | 100 day SMA | | 150 day SMA | | 200 day SMA |
|
|
