AlldigiTech ALLDIGI full analysis,charts,indicators,moving averages,SMA,DMA,EMA,ADX,MACD,RSIAlldigi Tech ALLDIGI WideScreen charts, DMA,SMA,EMA technical analysis, forecast prediction, by indicators ADX,MACD,RSI,CCI NSE stock exchange
Daily price and charts and targets AlldigiTech Strong Daily Stock price targets for AlldigiTech ALLDIGI are 903.45 and 915.25 | Daily Target 1 | 900.9 | | Daily Target 2 | 906 | | Daily Target 3 | 912.7 | | Daily Target 4 | 917.8 | | Daily Target 5 | 924.5 |
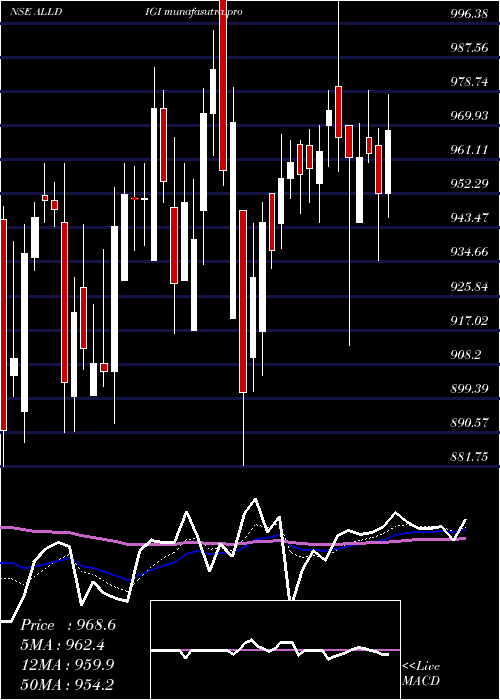
Daily price and volume Alldigi Tech
| Date |
Closing |
Open |
Range |
Volume |
Tue 28 October 2025 |
911.10 (0.39%) |
916.70 |
907.60 - 919.40 |
0.3815 times |
Mon 27 October 2025 |
907.60 (2.08%) |
889.15 |
885.05 - 945.00 |
3.8763 times |
Fri 24 October 2025 |
889.15 (-1.05%) |
901.00 |
883.00 - 904.45 |
0.4256 times |
Thu 23 October 2025 |
898.60 (0.22%) |
902.50 |
895.05 - 905.50 |
0.5346 times |
Tue 21 October 2025 |
896.65 (2.3%) |
869.00 |
869.00 - 898.05 |
0.2765 times |
Mon 20 October 2025 |
876.50 (1.07%) |
867.00 |
859.90 - 880.00 |
0.5747 times |
Fri 17 October 2025 |
867.20 (-1.81%) |
874.35 |
849.90 - 899.05 |
2.2278 times |
Thu 16 October 2025 |
883.20 (-1.23%) |
892.55 |
878.00 - 899.85 |
0.4673 times |
Wed 15 October 2025 |
894.20 (0.2%) |
898.20 |
890.00 - 898.20 |
0.2882 times |
Tue 14 October 2025 |
892.45 (2.56%) |
872.95 |
870.30 - 899.80 |
0.9474 times |
Mon 13 October 2025 |
870.20 (-1.98%) |
896.50 |
860.50 - 899.95 |
1.2847 times |
Weekly price and charts AlldigiTech Strong weekly Stock price targets for AlldigiTech ALLDIGI are 898.08 and 958.03 | Weekly Target 1 | 853.77 | | Weekly Target 2 | 882.43 | | Weekly Target 3 | 913.71666666667 | | Weekly Target 4 | 942.38 | | Weekly Target 5 | 973.67 |
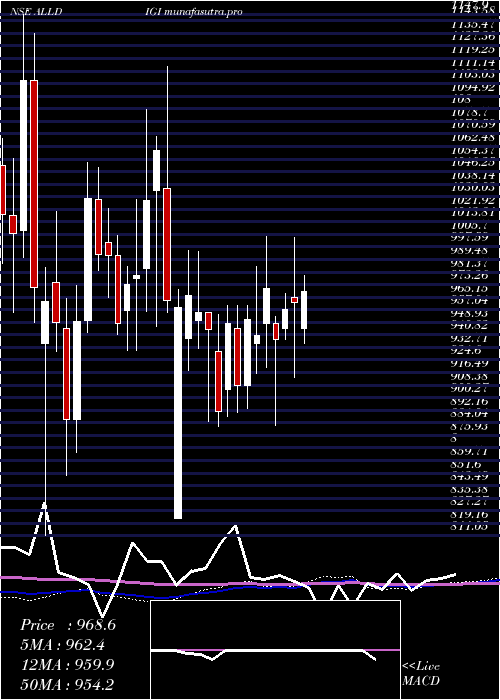
Weekly price and volumes for Alldigi Tech
| Date |
Closing |
Open |
Range |
Volume |
Tue 28 October 2025 |
911.10 (2.47%) |
889.15 |
885.05 - 945.00 |
0.9873 times |
Fri 24 October 2025 |
889.15 (2.53%) |
867.00 |
859.90 - 905.50 |
0.42 times |
Fri 17 October 2025 |
867.20 (-2.31%) |
896.50 |
849.90 - 899.95 |
1.2093 times |
Fri 10 October 2025 |
887.75 (-3.04%) |
915.60 |
880.35 - 928.95 |
2.2959 times |
Fri 03 October 2025 |
915.55 (-0.88%) |
923.60 |
909.00 - 955.00 |
0.5388 times |
Fri 26 September 2025 |
923.65 (-0.03%) |
920.00 |
912.85 - 969.00 |
0.7696 times |
Fri 19 September 2025 |
923.90 (-1.92%) |
935.00 |
908.95 - 957.00 |
0.9739 times |
Fri 12 September 2025 |
942.00 (0.2%) |
933.00 |
917.05 - 990.00 |
1.1988 times |
Fri 05 September 2025 |
940.15 (-3.15%) |
978.90 |
935.20 - 991.85 |
0.9087 times |
Fri 29 August 2025 |
970.75 (0.88%) |
969.80 |
941.00 - 985.00 |
0.6977 times |
Fri 22 August 2025 |
962.25 (-5.6%) |
1019.35 |
922.65 - 1030.35 |
2.1119 times |
Monthly price and charts AlldigiTech Strong monthly Stock price targets for AlldigiTech ALLDIGI are 827.95 and 933.05 | Monthly Target 1 | 800.23 | | Monthly Target 2 | 855.67 | | Monthly Target 3 | 905.33333333333 | | Monthly Target 4 | 960.77 | | Monthly Target 5 | 1010.43 |
Monthly price and volumes Alldigi Tech
| Date |
Closing |
Open |
Range |
Volume |
Tue 28 October 2025 |
911.10 (-2.75%) |
917.00 |
849.90 - 955.00 |
0.7253 times |
Tue 30 September 2025 |
936.85 (-3.49%) |
978.90 |
908.95 - 991.85 |
0.5549 times |
Fri 29 August 2025 |
970.75 (-2.46%) |
996.00 |
922.65 - 1084.00 |
1.2012 times |
Thu 31 July 2025 |
995.25 (7.47%) |
927.00 |
908.60 - 1059.95 |
1.3059 times |
Mon 30 June 2025 |
926.05 (0.37%) |
928.70 |
886.00 - 955.00 |
0.5567 times |
Fri 30 May 2025 |
922.60 (-3.12%) |
952.30 |
885.00 - 1017.80 |
0.911 times |
Wed 30 April 2025 |
952.30 (1.24%) |
948.10 |
882.00 - 1004.05 |
0.6345 times |
Fri 28 March 2025 |
940.60 (5.55%) |
905.30 |
888.05 - 984.90 |
0.9074 times |
Fri 28 February 2025 |
891.10 (-7.05%) |
938.80 |
881.75 - 995.00 |
1.0244 times |
Fri 31 January 2025 |
958.70 (0.72%) |
956.80 |
822.00 - 1114.40 |
2.1786 times |
Tue 31 December 2024 |
951.80 (-7.46%) |
1028.00 |
930.85 - 1049.00 |
0.9832 times |

DMA SMA EMA moving averages of Alldigi Tech ALLDIGI
DMA (daily moving average) of Alldigi Tech ALLDIGI
| DMA period | DMA value | | 5 day DMA | 900.62 | | 12 day DMA | 889.55 | | 20 day DMA | 897.88 | | 35 day DMA | 914.32 | | 50 day DMA | 929.47 | | 100 day DMA | 944.65 | | 150 day DMA | 946.21 | | 200 day DMA | 949.91 | EMA (exponential moving average) of Alldigi Tech ALLDIGI
| EMA period | EMA current | EMA prev | EMA prev2 | | 5 day EMA | 900.73 | 895.55 | 889.52 | | 12 day EMA | 896.84 | 894.25 | 891.82 | | 20 day EMA | 901.78 | 900.8 | 900.08 | | 35 day EMA | 917.44 | 917.81 | 918.41 | | 50 day EMA | 935.99 | 937.01 | 938.21 |
SMA (simple moving average) of Alldigi Tech ALLDIGI
| SMA period | SMA current | SMA prev | SMA prev2 | | 5 day SMA | 900.62 | 893.7 | 885.62 | | 12 day SMA | 889.55 | 887.47 | 886.51 | | 20 day SMA | 897.88 | 898.51 | 900.2 | | 35 day SMA | 914.32 | 915.15 | 916.68 | | 50 day SMA | 929.47 | 931.88 | 934.19 | | 100 day SMA | 944.65 | 944.64 | 944.71 | | 150 day SMA | 946.21 | 946.48 | 946.72 | | 200 day SMA | 949.91 | 950.17 | 950.53 |
|
|
