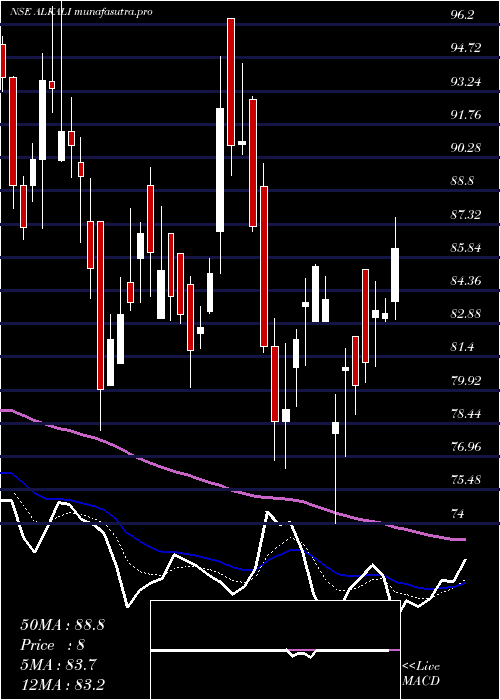
AlkaliMetals ALKALI full analysis,charts,indicators,moving averages,SMA,DMA,EMA,ADX,MACD,RSIAlkali Metals ALKALI WideScreen charts, DMA,SMA,EMA technical analysis, forecast prediction, by indicators ADX,MACD,RSI,CCI NSE stock exchange
operates under Specialty Chemicals sector
Daily price and charts and targets AlkaliMetals Strong Daily Stock price targets for AlkaliMetals ALKALI are 88.53 and 90.43 | Daily Target 1 | 87.09 | | Daily Target 2 | 88.07 | | Daily Target 3 | 88.986666666667 | | Daily Target 4 | 89.97 | | Daily Target 5 | 90.89 |
Daily price and volume Alkali Metals
| Date |
Closing |
Open |
Range |
Volume |
Tue 28 October 2025 |
89.06 (1.84%) |
88.00 |
88.00 - 89.90 |
0.2457 times |
Mon 27 October 2025 |
87.45 (-1.13%) |
90.70 |
87.00 - 90.70 |
0.2443 times |
Fri 24 October 2025 |
88.45 (-0.67%) |
88.93 |
88.15 - 89.49 |
0.2185 times |
Thu 23 October 2025 |
89.05 (-0.81%) |
92.00 |
88.90 - 92.00 |
0.225 times |
Tue 21 October 2025 |
89.78 (1.24%) |
89.00 |
89.00 - 91.47 |
0.0752 times |
Mon 20 October 2025 |
88.68 (0.75%) |
89.01 |
88.20 - 91.99 |
1.7324 times |
Fri 17 October 2025 |
88.02 (-1.73%) |
90.99 |
86.90 - 91.00 |
2.0057 times |
Thu 16 October 2025 |
89.57 (-0.95%) |
91.15 |
88.81 - 92.18 |
0.6906 times |
Wed 15 October 2025 |
90.43 (-1.98%) |
92.00 |
90.15 - 95.70 |
3.1734 times |
Tue 14 October 2025 |
92.26 (-3.12%) |
95.23 |
90.51 - 95.97 |
1.3893 times |
Mon 13 October 2025 |
95.23 (-3.91%) |
98.00 |
94.86 - 98.84 |
0.4206 times |
Weekly price and charts AlkaliMetals Strong weekly Stock price targets for AlkaliMetals ALKALI are 86.18 and 89.88 | Weekly Target 1 | 85.22 | | Weekly Target 2 | 87.14 | | Weekly Target 3 | 88.92 | | Weekly Target 4 | 90.84 | | Weekly Target 5 | 92.62 |
Weekly price and volumes for Alkali Metals
| Date |
Closing |
Open |
Range |
Volume |
Tue 28 October 2025 |
89.06 (0.69%) |
90.70 |
87.00 - 90.70 |
0.1006 times |
Fri 24 October 2025 |
88.45 (0.49%) |
89.01 |
88.15 - 92.00 |
0.4621 times |
Fri 17 October 2025 |
88.02 (-11.19%) |
98.00 |
86.90 - 98.84 |
1.5763 times |
Fri 10 October 2025 |
99.11 (7.93%) |
89.65 |
88.61 - 107.38 |
2.2902 times |
Fri 03 October 2025 |
91.83 (0.11%) |
93.11 |
89.50 - 95.50 |
0.9085 times |
Fri 26 September 2025 |
91.73 (-4.2%) |
93.40 |
91.20 - 98.49 |
1.0006 times |
Fri 19 September 2025 |
95.75 (2.25%) |
96.70 |
90.85 - 102.30 |
1.183 times |
Fri 12 September 2025 |
93.64 (9.7%) |
87.89 |
85.37 - 102.70 |
2.1241 times |
Fri 05 September 2025 |
85.36 (0.65%) |
86.68 |
84.75 - 88.51 |
0.1209 times |
Fri 29 August 2025 |
84.81 (-4.43%) |
91.00 |
84.00 - 91.58 |
0.2337 times |
Fri 22 August 2025 |
88.74 (1.78%) |
87.10 |
86.11 - 92.00 |
0.315 times |

Monthly price and charts AlkaliMetals Strong monthly Stock price targets for AlkaliMetals ALKALI are 77.74 and 98.22 | Monthly Target 1 | 73.97 | | Monthly Target 2 | 81.51 | | Monthly Target 3 | 94.446666666667 | | Monthly Target 4 | 101.99 | | Monthly Target 5 | 114.93 |
Monthly price and volumes Alkali Metals
| Date |
Closing |
Open |
Range |
Volume |
Tue 28 October 2025 |
89.06 (-4.21%) |
92.76 |
86.90 - 107.38 |
1.6884 times |
Tue 30 September 2025 |
92.97 (9.62%) |
86.68 |
84.75 - 102.70 |
1.7294 times |
Fri 29 August 2025 |
84.81 (-6.35%) |
92.10 |
83.86 - 92.53 |
0.3231 times |
Thu 31 July 2025 |
90.56 (-11.15%) |
102.10 |
90.00 - 104.00 |
0.5198 times |
Mon 30 June 2025 |
101.93 (-0.91%) |
102.02 |
95.82 - 109.00 |
0.7114 times |
Fri 30 May 2025 |
102.87 (22.29%) |
83.00 |
77.88 - 117.79 |
2.2514 times |
Wed 30 April 2025 |
84.12 (6.39%) |
80.94 |
74.00 - 94.00 |
0.7537 times |
Fri 28 March 2025 |
79.07 (-7.35%) |
87.45 |
76.45 - 96.45 |
0.9087 times |
Fri 28 February 2025 |
85.34 (-15.64%) |
104.60 |
84.02 - 104.60 |
0.44 times |
Fri 31 January 2025 |
101.16 (-9.56%) |
111.00 |
95.00 - 118.00 |
0.6742 times |
Tue 31 December 2024 |
111.85 (-3.79%) |
119.51 |
109.10 - 124.90 |
1.2605 times |

DMA SMA EMA moving averages of Alkali Metals ALKALI
DMA (daily moving average) of Alkali Metals ALKALI
| DMA period | DMA value | | 5 day DMA | 88.76 | | 12 day DMA | 90.59 | | 20 day DMA | 91.36 | | 35 day DMA | 92.41 | | 50 day DMA | 90.84 | | 100 day DMA | 93.65 | | 150 day DMA | 92.1 | | 200 day DMA | 92.95 | EMA (exponential moving average) of Alkali Metals ALKALI
| EMA period | EMA current | EMA prev | EMA prev2 | | 5 day EMA | 88.78 | 88.64 | 89.24 | | 12 day EMA | 89.96 | 90.12 | 90.6 | | 20 day EMA | 90.72 | 90.89 | 91.25 | | 35 day EMA | 90.55 | 90.64 | 90.83 | | 50 day EMA | 90.33 | 90.38 | 90.5 |
SMA (simple moving average) of Alkali Metals ALKALI
| SMA period | SMA current | SMA prev | SMA prev2 | | 5 day SMA | 88.76 | 88.68 | 88.8 | | 12 day SMA | 90.59 | 91.77 | 91.94 | | 20 day SMA | 91.36 | 91.49 | 91.88 | | 35 day SMA | 92.41 | 92.31 | 92.29 | | 50 day SMA | 90.84 | 90.81 | 90.8 | | 100 day SMA | 93.65 | 93.79 | 93.97 | | 150 day SMA | 92.1 | 92.07 | 92.04 | | 200 day SMA | 92.95 | 93.06 | 93.2 |
|
|
