Alembic ALEMBICLTD full analysis,charts,indicators,moving averages,SMA,DMA,EMA,ADX,MACD,RSIAlembic ALEMBICLTD WideScreen charts, DMA,SMA,EMA technical analysis, forecast prediction, by indicators ADX,MACD,RSI,CCI NSE stock exchange
operates under Pharmaceuticals sector
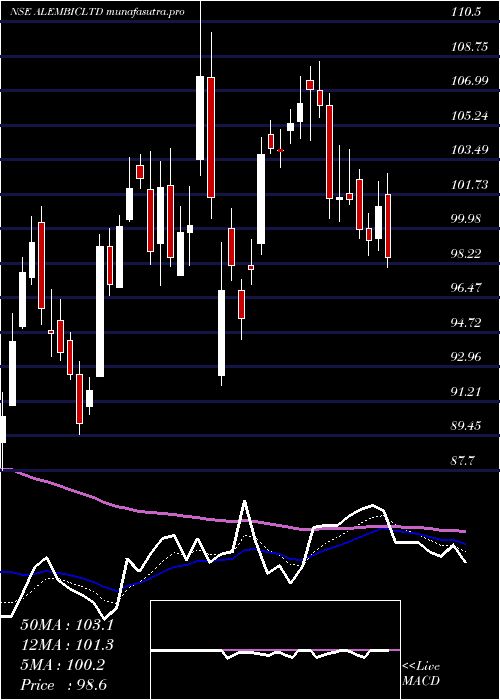
Daily price and charts and targets Alembic Strong Daily Stock price targets for Alembic ALEMBICLTD are 95.65 and 99.89 | Daily Target 1 | 94.58 | | Daily Target 2 | 96.71 | | Daily Target 3 | 98.823333333333 | | Daily Target 4 | 100.95 | | Daily Target 5 | 103.06 |
Daily price and volume Alembic
| Date |
Closing |
Open |
Range |
Volume |
Tue 28 October 2025 |
98.83 (-1.45%) |
100.77 |
96.70 - 100.94 |
0.9715 times |
Mon 27 October 2025 |
100.28 (-0.52%) |
101.70 |
100.10 - 101.70 |
0.5574 times |
Fri 24 October 2025 |
100.80 (-0.11%) |
100.61 |
100.00 - 101.57 |
0.618 times |
Thu 23 October 2025 |
100.91 (-1.61%) |
102.70 |
100.64 - 103.40 |
0.7569 times |
Tue 21 October 2025 |
102.56 (1.1%) |
101.50 |
101.50 - 102.80 |
0.667 times |
Mon 20 October 2025 |
101.44 (1.49%) |
101.00 |
99.00 - 101.60 |
0.8881 times |
Fri 17 October 2025 |
99.95 (2.09%) |
98.35 |
97.58 - 100.65 |
1.9808 times |
Thu 16 October 2025 |
97.90 (-1.77%) |
99.80 |
97.00 - 100.19 |
1.8109 times |
Wed 15 October 2025 |
99.66 (2.13%) |
97.50 |
97.00 - 99.90 |
0.7765 times |
Tue 14 October 2025 |
97.58 (-0.76%) |
98.99 |
96.60 - 98.99 |
0.9729 times |
Mon 13 October 2025 |
98.33 (-2.17%) |
99.99 |
96.31 - 100.39 |
1.7092 times |
Weekly price and charts Alembic Strong weekly Stock price targets for Alembic ALEMBICLTD are 95.27 and 100.27 | Weekly Target 1 | 94.08 | | Weekly Target 2 | 96.45 | | Weekly Target 3 | 99.076666666667 | | Weekly Target 4 | 101.45 | | Weekly Target 5 | 104.08 |
Weekly price and volumes for Alembic
| Date |
Closing |
Open |
Range |
Volume |
Tue 28 October 2025 |
98.83 (-1.95%) |
101.70 |
96.70 - 101.70 |
0.3667 times |
Fri 24 October 2025 |
100.80 (0.85%) |
101.00 |
99.00 - 103.40 |
0.7027 times |
Fri 17 October 2025 |
99.95 (-0.56%) |
99.99 |
96.31 - 100.65 |
1.7388 times |
Fri 10 October 2025 |
100.51 (-2.77%) |
103.25 |
99.90 - 103.29 |
0.8842 times |
Fri 03 October 2025 |
103.37 (3.6%) |
100.80 |
99.40 - 104.28 |
0.9743 times |
Fri 26 September 2025 |
99.78 (-6.34%) |
106.10 |
99.40 - 107.96 |
1.0679 times |
Fri 19 September 2025 |
106.53 (3.27%) |
103.59 |
103.59 - 108.50 |
1.4018 times |
Fri 12 September 2025 |
103.16 (-1.09%) |
104.30 |
102.50 - 105.96 |
1.0044 times |
Fri 05 September 2025 |
104.30 (2.73%) |
101.53 |
101.50 - 107.59 |
1.1062 times |
Fri 29 August 2025 |
101.53 (-3.78%) |
105.79 |
100.50 - 106.40 |
0.7531 times |
Fri 22 August 2025 |
105.52 (-0.29%) |
106.90 |
105.05 - 109.91 |
1.1728 times |
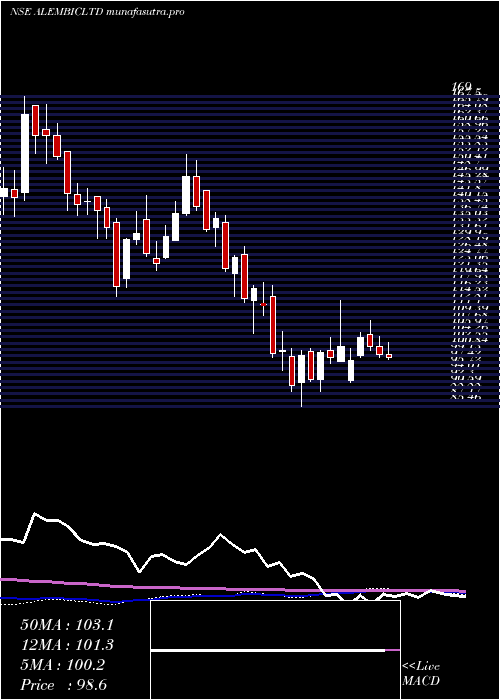
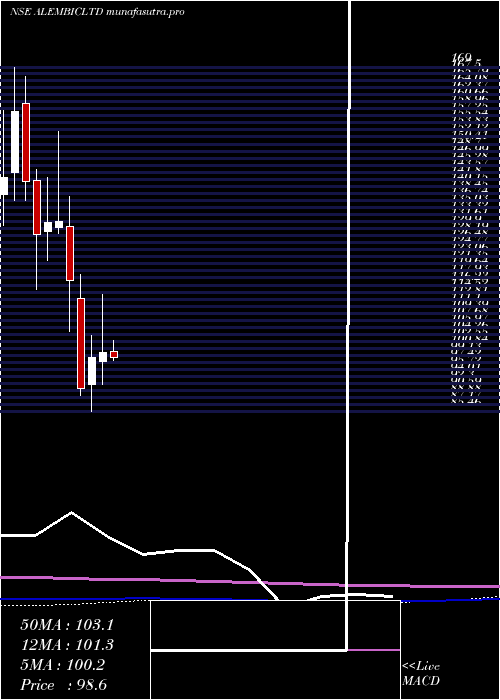
Monthly price and charts Alembic Strong monthly Stock price targets for Alembic ALEMBICLTD are 93.59 and 101.56 | Monthly Target 1 | 91.84 | | Monthly Target 2 | 95.33 | | Monthly Target 3 | 99.806666666667 | | Monthly Target 4 | 103.3 | | Monthly Target 5 | 107.78 |
Monthly price and volumes Alembic
| Date |
Closing |
Open |
Range |
Volume |
Tue 28 October 2025 |
98.83 (-0.95%) |
99.78 |
96.31 - 104.28 |
0.4579 times |
Tue 30 September 2025 |
99.78 (-1.72%) |
101.53 |
99.40 - 108.50 |
0.5319 times |
Fri 29 August 2025 |
101.53 (-9.45%) |
112.00 |
100.50 - 114.80 |
0.4822 times |
Thu 31 July 2025 |
112.12 (-7.95%) |
124.70 |
110.56 - 124.70 |
0.9941 times |
Mon 30 June 2025 |
121.80 (10.2%) |
110.43 |
109.10 - 125.54 |
2.1109 times |
Fri 30 May 2025 |
110.53 (10.57%) |
100.00 |
95.05 - 115.25 |
1.1078 times |
Wed 30 April 2025 |
99.96 (1.44%) |
97.61 |
92.00 - 113.95 |
1.604 times |
Fri 28 March 2025 |
98.54 (8.19%) |
91.99 |
85.46 - 104.05 |
1.0919 times |
Fri 28 February 2025 |
91.08 (-22.38%) |
113.00 |
89.44 - 118.87 |
0.731 times |
Fri 31 January 2025 |
117.34 (-10.88%) |
130.50 |
105.00 - 137.66 |
0.8884 times |
Tue 31 December 2024 |
131.66 (0.22%) |
130.20 |
128.65 - 153.39 |
2.0321 times |
DMA SMA EMA moving averages of Alembic ALEMBICLTD
DMA (daily moving average) of Alembic ALEMBICLTD
| DMA period | DMA value | | 5 day DMA | 100.68 | | 12 day DMA | 99.9 | | 20 day DMA | 100.53 | | 35 day DMA | 102.25 | | 50 day DMA | 103.03 | | 100 day DMA | 109.01 | | 150 day DMA | 107.41 | | 200 day DMA | 107.56 | EMA (exponential moving average) of Alembic ALEMBICLTD
| EMA period | EMA current | EMA prev | EMA prev2 | | 5 day EMA | 100.04 | 100.65 | 100.84 | | 12 day EMA | 100.37 | 100.65 | 100.72 | | 20 day EMA | 100.89 | 101.11 | 101.2 | | 35 day EMA | 101.9 | 102.08 | 102.19 | | 50 day EMA | 103.15 | 103.33 | 103.45 |
SMA (simple moving average) of Alembic ALEMBICLTD
| SMA period | SMA current | SMA prev | SMA prev2 | | 5 day SMA | 100.68 | 101.2 | 101.13 | | 12 day SMA | 99.9 | 100.01 | 100.06 | | 20 day SMA | 100.53 | 100.58 | 100.72 | | 35 day SMA | 102.25 | 102.41 | 102.52 | | 50 day SMA | 103.03 | 103.16 | 103.32 | | 100 day SMA | 109.01 | 109.13 | 109.22 | | 150 day SMA | 107.41 | 107.42 | 107.36 | | 200 day SMA | 107.56 | 107.7 | 107.88 |
|
|
