AlbertDavid ALBERTDAVD full analysis,charts,indicators,moving averages,SMA,DMA,EMA,ADX,MACD,RSIAlbert David ALBERTDAVD WideScreen charts, DMA,SMA,EMA technical analysis, forecast prediction, by indicators ADX,MACD,RSI,CCI NSE stock exchange
operates under Pharmaceuticals sector
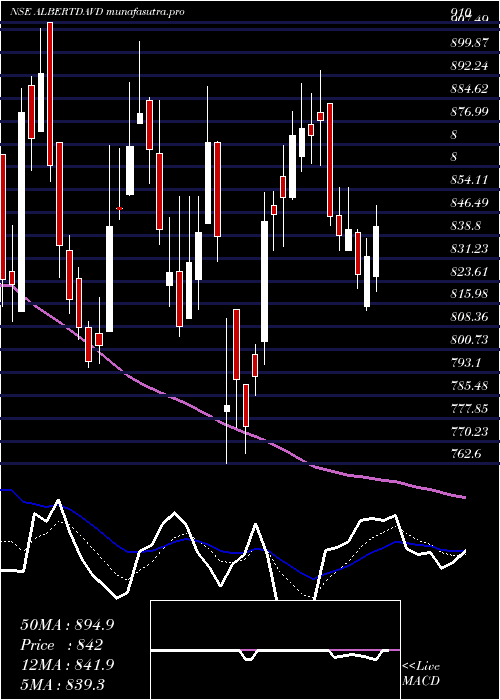
Daily price and charts and targets AlbertDavid Strong Daily Stock price targets for AlbertDavid ALBERTDAVD are 845.68 and 874.73 | Daily Target 1 | 823.55 | | Daily Target 2 | 838.75 | | Daily Target 3 | 852.6 | | Daily Target 4 | 867.8 | | Daily Target 5 | 881.65 |
Daily price and volume Albert David
| Date |
Closing |
Open |
Range |
Volume |
Wed 29 October 2025 |
853.95 (1.89%) |
850.70 |
837.40 - 866.45 |
2.428 times |
Tue 28 October 2025 |
838.10 (3.78%) |
806.15 |
804.20 - 848.00 |
3.3741 times |
Mon 27 October 2025 |
807.60 (0.81%) |
804.70 |
802.05 - 812.85 |
0.6516 times |
Fri 24 October 2025 |
801.15 (-0.41%) |
803.95 |
799.00 - 806.90 |
0.2815 times |
Thu 23 October 2025 |
804.45 (0.84%) |
803.80 |
795.10 - 809.70 |
0.7139 times |
Tue 21 October 2025 |
797.75 (0.45%) |
794.20 |
789.00 - 804.00 |
0.5261 times |
Mon 20 October 2025 |
794.20 (0.28%) |
803.90 |
791.00 - 806.00 |
0.3007 times |
Fri 17 October 2025 |
792.00 (-0.25%) |
789.00 |
789.00 - 815.00 |
0.8598 times |
Thu 16 October 2025 |
794.00 (-0.88%) |
801.05 |
790.00 - 801.05 |
0.3046 times |
Wed 15 October 2025 |
801.05 (1.57%) |
798.95 |
794.55 - 805.00 |
0.5598 times |
Tue 14 October 2025 |
788.70 (-0.97%) |
796.75 |
787.00 - 804.55 |
1.0402 times |
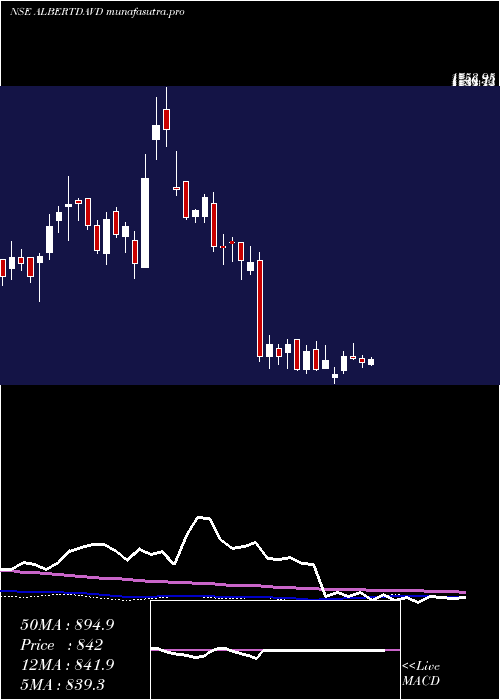
Weekly price and charts AlbertDavid Strong weekly Stock price targets for AlbertDavid ALBERTDAVD are 828 and 892.4 | Weekly Target 1 | 776.42 | | Weekly Target 2 | 815.18 | | Weekly Target 3 | 840.81666666667 | | Weekly Target 4 | 879.58 | | Weekly Target 5 | 905.22 |
Weekly price and volumes for Albert David
| Date |
Closing |
Open |
Range |
Volume |
Wed 29 October 2025 |
853.95 (6.59%) |
804.70 |
802.05 - 866.45 |
1.6245 times |
Fri 24 October 2025 |
801.15 (1.16%) |
803.90 |
789.00 - 809.70 |
0.4586 times |
Fri 17 October 2025 |
792.00 (-1.3%) |
800.00 |
787.00 - 815.00 |
0.8237 times |
Fri 10 October 2025 |
802.40 (1.89%) |
793.75 |
780.00 - 808.15 |
0.8513 times |
Fri 03 October 2025 |
787.50 (1.43%) |
788.00 |
771.40 - 792.45 |
0.5107 times |
Fri 26 September 2025 |
776.40 (-3.2%) |
806.55 |
775.00 - 816.30 |
1.0524 times |
Fri 19 September 2025 |
802.05 (-0.15%) |
812.85 |
796.00 - 818.30 |
1.7977 times |
Fri 12 September 2025 |
803.25 (0.32%) |
812.70 |
795.00 - 818.95 |
0.8357 times |
Fri 05 September 2025 |
800.70 (-0.09%) |
801.40 |
789.95 - 820.00 |
1.3751 times |
Fri 29 August 2025 |
801.40 (-1.1%) |
813.95 |
788.40 - 815.00 |
0.6702 times |
Fri 22 August 2025 |
810.30 (0.05%) |
809.90 |
800.55 - 824.00 |
1.154 times |
Monthly price and charts AlbertDavid Strong monthly Stock price targets for AlbertDavid ALBERTDAVD are 814.48 and 905.93 | Monthly Target 1 | 740.35 | | Monthly Target 2 | 797.15 | | Monthly Target 3 | 831.8 | | Monthly Target 4 | 888.6 | | Monthly Target 5 | 923.25 |
Monthly price and volumes Albert David
| Date |
Closing |
Open |
Range |
Volume |
Wed 29 October 2025 |
853.95 (9.31%) |
785.80 |
775.00 - 866.45 |
0.3411 times |
Tue 30 September 2025 |
781.25 (-2.51%) |
801.40 |
771.40 - 820.00 |
0.4559 times |
Fri 29 August 2025 |
801.40 (-10.06%) |
896.15 |
788.40 - 915.05 |
0.6142 times |
Thu 31 July 2025 |
891.05 (6.57%) |
835.10 |
835.10 - 957.50 |
1.2298 times |
Mon 30 June 2025 |
836.10 (4.22%) |
807.00 |
797.20 - 874.90 |
0.9483 times |
Fri 30 May 2025 |
802.25 (-2.85%) |
815.00 |
786.45 - 919.50 |
1.0412 times |
Wed 30 April 2025 |
825.75 (2.16%) |
811.00 |
762.60 - 894.00 |
0.8835 times |
Fri 28 March 2025 |
808.30 (-5.05%) |
866.00 |
794.60 - 910.00 |
1.9648 times |
Fri 28 February 2025 |
851.30 (-27.44%) |
1139.00 |
812.05 - 1218.85 |
1.5353 times |
Fri 31 January 2025 |
1173.30 (-11.59%) |
1325.00 |
1108.50 - 1400.00 |
0.9859 times |
Tue 31 December 2024 |
1327.10 (-17.65%) |
1419.00 |
1300.20 - 1540.00 |
1.6618 times |
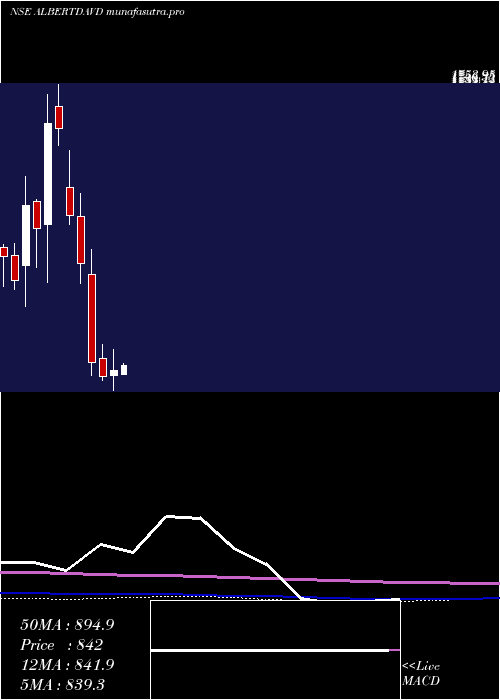
DMA SMA EMA moving averages of Albert David ALBERTDAVD
DMA (daily moving average) of Albert David ALBERTDAVD
| DMA period | DMA value | | 5 day DMA | 821.05 | | 12 day DMA | 805.78 | | 20 day DMA | 798.99 | | 35 day DMA | 799.03 | | 50 day DMA | 800.94 | | 100 day DMA | 835.59 | | 150 day DMA | 833.72 | | 200 day DMA | 883.52 | EMA (exponential moving average) of Albert David ALBERTDAVD
| EMA period | EMA current | EMA prev | EMA prev2 | | 5 day EMA | 827.36 | 814.07 | 802.05 | | 12 day EMA | 812.01 | 804.39 | 798.26 | | 20 day EMA | 805.98 | 800.93 | 797.02 | | 35 day EMA | 803.31 | 800.33 | 798.11 | | 50 day EMA | 803.52 | 801.46 | 799.96 |
SMA (simple moving average) of Albert David ALBERTDAVD
| SMA period | SMA current | SMA prev | SMA prev2 | | 5 day SMA | 821.05 | 809.81 | 801.03 | | 12 day SMA | 805.78 | 801.49 | 797.59 | | 20 day SMA | 798.99 | 795.33 | 792.25 | | 35 day SMA | 799.03 | 797.48 | 796.42 | | 50 day SMA | 800.94 | 800.06 | 799.49 | | 100 day SMA | 835.59 | 835.06 | 834.67 | | 150 day SMA | 833.72 | 833.68 | 833.71 | | 200 day SMA | 883.52 | 886.02 | 888.44 |
|
|
