AgiGreenpac AGI full analysis,charts,indicators,moving averages,SMA,DMA,EMA,ADX,MACD,RSIAgi Greenpac AGI WideScreen charts, DMA,SMA,EMA technical analysis, forecast prediction, by indicators ADX,MACD,RSI,CCI NSE stock exchange
Daily price and charts and targets AgiGreenpac Strong Daily Stock price targets for AgiGreenpac AGI are 819.05 and 832.9 | Daily Target 1 | 816.22 | | Daily Target 2 | 821.88 | | Daily Target 3 | 830.06666666667 | | Daily Target 4 | 835.73 | | Daily Target 5 | 843.92 |
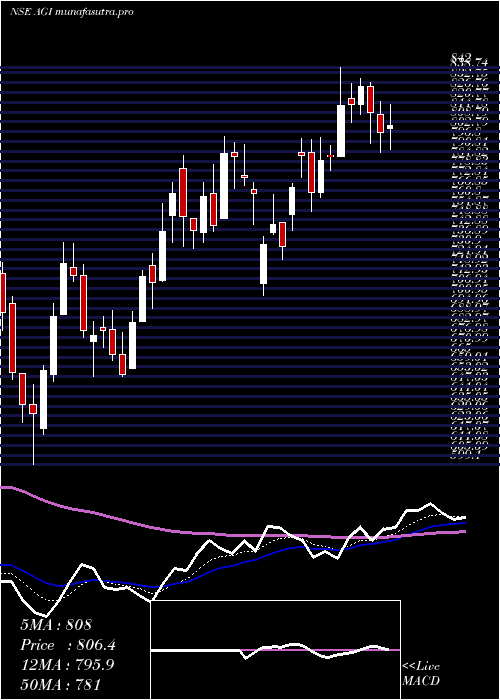
Daily price and volume Agi Greenpac
| Date |
Closing |
Open |
Range |
Volume |
Tue 28 October 2025 |
827.55 (-0.74%) |
835.00 |
824.40 - 838.25 |
0.5741 times |
Mon 27 October 2025 |
833.70 (0.78%) |
828.30 |
825.70 - 840.00 |
0.7672 times |
Fri 24 October 2025 |
827.25 (-0.01%) |
832.30 |
822.30 - 837.60 |
0.8049 times |
Thu 23 October 2025 |
827.35 (-2.53%) |
848.85 |
825.50 - 848.85 |
1.5827 times |
Tue 21 October 2025 |
848.85 (3.37%) |
821.20 |
821.00 - 853.00 |
0.7144 times |
Mon 20 October 2025 |
821.20 (-2.76%) |
840.00 |
808.05 - 840.00 |
1.6368 times |
Fri 17 October 2025 |
844.55 (-3.01%) |
870.80 |
840.60 - 875.00 |
1.5109 times |
Thu 16 October 2025 |
870.80 (0.43%) |
870.00 |
861.10 - 874.95 |
0.5422 times |
Wed 15 October 2025 |
867.10 (0.6%) |
862.05 |
846.10 - 882.00 |
1.2339 times |
Tue 14 October 2025 |
861.90 (-2.67%) |
885.80 |
860.00 - 896.15 |
0.6331 times |
Mon 13 October 2025 |
885.55 (1.26%) |
865.00 |
864.00 - 893.90 |
0.8509 times |
Weekly price and charts AgiGreenpac Strong weekly Stock price targets for AgiGreenpac AGI are 818.18 and 833.78 | Weekly Target 1 | 815.05 | | Weekly Target 2 | 821.3 | | Weekly Target 3 | 830.65 | | Weekly Target 4 | 836.9 | | Weekly Target 5 | 846.25 |
Weekly price and volumes for Agi Greenpac
| Date |
Closing |
Open |
Range |
Volume |
Tue 28 October 2025 |
827.55 (0.04%) |
828.30 |
824.40 - 840.00 |
0.2104 times |
Fri 24 October 2025 |
827.25 (-2.05%) |
840.00 |
808.05 - 853.00 |
0.7433 times |
Fri 17 October 2025 |
844.55 (-3.42%) |
865.00 |
840.60 - 896.15 |
0.7483 times |
Fri 10 October 2025 |
874.50 (-1.3%) |
896.00 |
853.65 - 896.00 |
0.5808 times |
Fri 03 October 2025 |
886.05 (1.73%) |
876.00 |
841.10 - 889.90 |
0.7091 times |
Fri 26 September 2025 |
870.95 (3.72%) |
839.70 |
824.30 - 939.00 |
3.4664 times |
Fri 19 September 2025 |
839.70 (0.1%) |
845.55 |
832.30 - 886.00 |
1.4006 times |
Fri 12 September 2025 |
838.85 (-2.34%) |
866.55 |
835.20 - 875.40 |
0.5912 times |
Fri 05 September 2025 |
858.95 (-3.83%) |
890.00 |
851.30 - 906.85 |
0.8003 times |
Fri 29 August 2025 |
893.15 (-5.38%) |
945.40 |
888.00 - 948.90 |
0.7497 times |
Fri 22 August 2025 |
943.95 (1.83%) |
930.00 |
917.80 - 967.00 |
1.5948 times |
Monthly price and charts AgiGreenpac Strong monthly Stock price targets for AgiGreenpac AGI are 773.75 and 861.85 | Monthly Target 1 | 755.82 | | Monthly Target 2 | 791.68 | | Monthly Target 3 | 843.91666666667 | | Monthly Target 4 | 879.78 | | Monthly Target 5 | 932.02 |
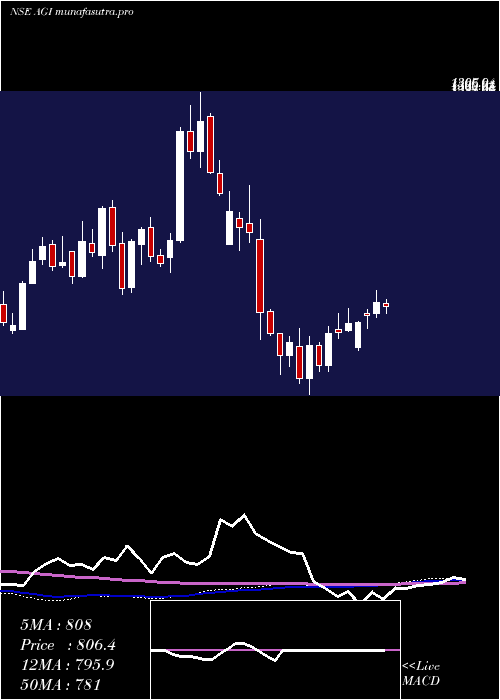
Monthly price and volumes Agi Greenpac
| Date |
Closing |
Open |
Range |
Volume |
Tue 28 October 2025 |
827.55 (-2%) |
845.00 |
808.05 - 896.15 |
0.2428 times |
Tue 30 September 2025 |
844.40 (-5.46%) |
890.00 |
824.30 - 939.00 |
0.613 times |
Fri 29 August 2025 |
893.15 (-7.23%) |
962.80 |
887.00 - 992.00 |
0.5008 times |
Thu 31 July 2025 |
962.80 (17.14%) |
821.95 |
771.10 - 1009.00 |
3.2574 times |
Mon 30 June 2025 |
821.95 (-2.4%) |
846.90 |
774.75 - 876.00 |
0.3701 times |
Fri 30 May 2025 |
842.20 (3.12%) |
816.00 |
760.00 - 886.70 |
0.6118 times |
Wed 30 April 2025 |
816.75 (9.56%) |
750.00 |
702.50 - 843.05 |
0.6942 times |
Fri 28 March 2025 |
745.50 (17.24%) |
636.00 |
599.10 - 788.00 |
0.9154 times |
Fri 28 February 2025 |
635.90 (-19.6%) |
794.75 |
625.00 - 797.50 |
0.8431 times |
Fri 31 January 2025 |
790.90 (-29.42%) |
1127.50 |
728.20 - 1148.75 |
1.9515 times |
Tue 31 December 2024 |
1120.55 (16.81%) |
959.55 |
956.30 - 1307.90 |
1.6106 times |

DMA SMA EMA moving averages of Agi Greenpac AGI
DMA (daily moving average) of Agi Greenpac AGI
| DMA period | DMA value | | 5 day DMA | 832.94 | | 12 day DMA | 849.19 | | 20 day DMA | 855.26 | | 35 day DMA | 857.16 | | 50 day DMA | 872.74 | | 100 day DMA | 867.39 | | 150 day DMA | 846.48 | | 200 day DMA | 834.5 | EMA (exponential moving average) of Agi Greenpac AGI
| EMA period | EMA current | EMA prev | EMA prev2 | | 5 day EMA | 832.96 | 835.67 | 836.65 | | 12 day EMA | 843.47 | 846.36 | 848.66 | | 20 day EMA | 851.04 | 853.51 | 855.59 | | 35 day EMA | 862.8 | 864.88 | 866.72 | | 50 day EMA | 871.83 | 873.64 | 875.27 |
SMA (simple moving average) of Agi Greenpac AGI
| SMA period | SMA current | SMA prev | SMA prev2 | | 5 day SMA | 832.94 | 831.67 | 833.84 | | 12 day SMA | 849.19 | 853.33 | 855.25 | | 20 day SMA | 855.26 | 857.43 | 860 | | 35 day SMA | 857.16 | 858.05 | 858.77 | | 50 day SMA | 872.74 | 874.2 | 875.37 | | 100 day SMA | 867.39 | 867.52 | 867.66 | | 150 day SMA | 846.48 | 845.72 | 844.74 | | 200 day SMA | 834.5 | 835.36 | 836.54 |
|
|
