AbansFinancial AFSL full analysis,charts,indicators,moving averages,SMA,DMA,EMA,ADX,MACD,RSIAbans Financial AFSL WideScreen charts, DMA,SMA,EMA technical analysis, forecast prediction, by indicators ADX,MACD,RSI,CCI NSE stock exchange
Daily price and charts and targets AbansFinancial Strong Daily Stock price targets for AbansFinancial AFSL are 199.67 and 202.42 | Daily Target 1 | 199.18 | | Daily Target 2 | 200.11 | | Daily Target 3 | 201.93 | | Daily Target 4 | 202.86 | | Daily Target 5 | 204.68 |
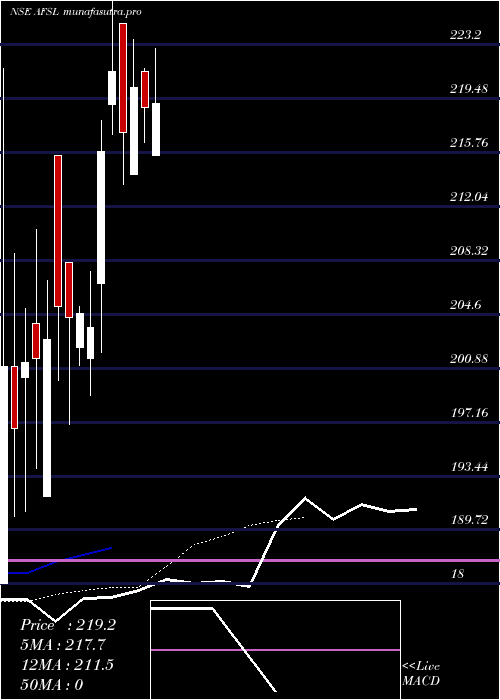
Daily price and volume Abans Financial
| Date |
Closing |
Open |
Range |
Volume |
Tue 28 October 2025 |
201.04 (-0.61%) |
201.04 |
201.00 - 203.75 |
0.877 times |
Mon 27 October 2025 |
202.27 (0.46%) |
201.02 |
201.00 - 204.00 |
1.4405 times |
Fri 24 October 2025 |
201.34 (-0.68%) |
202.71 |
201.00 - 205.00 |
2.8777 times |
Thu 23 October 2025 |
202.71 (-1.73%) |
207.50 |
201.01 - 207.50 |
0.7355 times |
Tue 21 October 2025 |
206.28 (2.61%) |
201.00 |
201.00 - 207.61 |
0.4197 times |
Mon 20 October 2025 |
201.04 (-0.12%) |
204.00 |
201.00 - 204.00 |
1.9759 times |
Fri 17 October 2025 |
201.28 (0.11%) |
202.88 |
201.00 - 205.01 |
0.9684 times |
Thu 16 October 2025 |
201.06 (-0.09%) |
201.02 |
201.00 - 202.89 |
0.2872 times |
Wed 15 October 2025 |
201.24 (0.09%) |
201.06 |
201.00 - 202.44 |
0.1957 times |
Tue 14 October 2025 |
201.06 (0.03%) |
202.00 |
201.00 - 202.79 |
0.2225 times |
Mon 13 October 2025 |
201.00 (-0.68%) |
200.00 |
194.41 - 203.47 |
1.8659 times |
Weekly price and charts AbansFinancial Strong weekly Stock price targets for AbansFinancial AFSL are 201.02 and 204.02 | Weekly Target 1 | 199.01 | | Weekly Target 2 | 200.03 | | Weekly Target 3 | 202.01333333333 | | Weekly Target 4 | 203.03 | | Weekly Target 5 | 205.01 |
Weekly price and volumes for Abans Financial
| Date |
Closing |
Open |
Range |
Volume |
Tue 28 October 2025 |
201.04 (-0.15%) |
201.02 |
201.00 - 204.00 |
0.4735 times |
Fri 24 October 2025 |
201.34 (0.03%) |
204.00 |
201.00 - 207.61 |
1.2276 times |
Fri 17 October 2025 |
201.28 (-0.54%) |
200.00 |
194.41 - 205.01 |
0.7232 times |
Fri 10 October 2025 |
202.38 (-1.91%) |
205.05 |
201.00 - 208.79 |
1.4909 times |
Fri 03 October 2025 |
206.32 (0.51%) |
205.27 |
205.00 - 208.67 |
0.6274 times |
Fri 26 September 2025 |
205.27 (-3.3%) |
211.41 |
205.00 - 216.12 |
0.4872 times |
Fri 19 September 2025 |
212.28 (-1.01%) |
210.00 |
209.25 - 222.20 |
0.8833 times |
Fri 12 September 2025 |
214.45 (-2.22%) |
219.31 |
213.73 - 224.89 |
0.6239 times |
Fri 05 September 2025 |
219.31 (1.24%) |
214.60 |
207.30 - 229.00 |
2.3041 times |
Fri 29 August 2025 |
216.62 (-1.99%) |
222.90 |
213.25 - 224.95 |
1.159 times |
Fri 22 August 2025 |
221.02 (0.35%) |
221.36 |
220.00 - 226.60 |
0.9015 times |

Monthly price and charts AbansFinancial Strong monthly Stock price targets for AbansFinancial AFSL are 190.54 and 204.92 | Monthly Target 1 | 187.03 | | Monthly Target 2 | 194.04 | | Monthly Target 3 | 201.41333333333 | | Monthly Target 4 | 208.42 | | Monthly Target 5 | 215.79 |
Monthly price and volumes Abans Financial
| Date |
Closing |
Open |
Range |
Volume |
Tue 28 October 2025 |
201.04 (-1.96%) |
206.08 |
194.41 - 208.79 |
0.3858 times |
Tue 30 September 2025 |
205.05 (-5.34%) |
214.60 |
205.00 - 229.00 |
0.3999 times |
Fri 29 August 2025 |
216.62 (-1.71%) |
202.20 |
200.60 - 236.00 |
0.4227 times |
Thu 31 July 2025 |
220.39 (-11.2%) |
250.65 |
215.00 - 260.69 |
1.779 times |
Mon 30 June 2025 |
248.18 (18.6%) |
211.35 |
209.01 - 269.50 |
1.7738 times |
Fri 30 May 2025 |
209.25 (0%) |
186.00 |
186.00 - 227.51 |
1.2389 times |
Tue 28 October 2025 |
(0%) |
|
- |
0 times |

DMA SMA EMA moving averages of Abans Financial AFSL
DMA (daily moving average) of Abans Financial AFSL
| DMA period | DMA value | | 5 day DMA | 202.73 | | 12 day DMA | 201.89 | | 20 day DMA | 202.74 | | 35 day DMA | 207.18 | | 50 day DMA | 211.09 | | 100 day DMA | 222.54 | | 150 day DMA | | | 200 day DMA | | EMA (exponential moving average) of Abans Financial AFSL
| EMA period | EMA current | EMA prev | EMA prev2 | | 5 day EMA | 201.89 | 202.32 | 202.35 | | 12 day EMA | 202.46 | 202.72 | 202.8 | | 20 day EMA | 203.82 | 204.11 | 204.3 | | 35 day EMA | 207.15 | 207.51 | 207.82 | | 50 day EMA | 211.01 | 211.42 | 211.79 |
SMA (simple moving average) of Abans Financial AFSL
| SMA period | SMA current | SMA prev | SMA prev2 | | 5 day SMA | 202.73 | 202.73 | 202.53 | | 12 day SMA | 201.89 | 201.9 | 201.84 | | 20 day SMA | 202.74 | 202.95 | 203.22 | | 35 day SMA | 207.18 | 207.7 | 208.37 | | 50 day SMA | 211.09 | 211.48 | 211.84 | | 100 day SMA | 222.54 | 222.72 | 222.87 | | 150 day SMA | | 200 day SMA |
|
|
