AffleIndia AFFLE full analysis,charts,indicators,moving averages,SMA,DMA,EMA,ADX,MACD,RSIAffle India AFFLE WideScreen charts, DMA,SMA,EMA technical analysis, forecast prediction, by indicators ADX,MACD,RSI,CCI NSE stock exchange
Daily price and charts and targets AffleIndia Strong Daily Stock price targets for AffleIndia AFFLE are 1918.25 and 1955.75 | Daily Target 1 | 1892 | | Daily Target 2 | 1907 | | Daily Target 3 | 1929.5 | | Daily Target 4 | 1944.5 | | Daily Target 5 | 1967 |
Daily price and volume Affle India
| Date |
Closing |
Open |
Range |
Volume |
Tue 28 October 2025 |
1922.00 (0.13%) |
1919.60 |
1914.50 - 1952.00 |
1.1613 times |
Mon 27 October 2025 |
1919.60 (1.71%) |
1887.40 |
1884.20 - 1929.00 |
0.7972 times |
Fri 24 October 2025 |
1887.40 (-0.69%) |
1900.50 |
1877.00 - 1904.30 |
0.7394 times |
Thu 23 October 2025 |
1900.50 (1.04%) |
1880.90 |
1863.00 - 1935.90 |
1.5756 times |
Tue 21 October 2025 |
1880.90 (-0.29%) |
1886.70 |
1872.40 - 1912.20 |
0.2721 times |
Mon 20 October 2025 |
1886.40 (-0.3%) |
1896.00 |
1878.30 - 1910.90 |
1.037 times |
Fri 17 October 2025 |
1892.10 (-2.8%) |
1945.00 |
1889.00 - 1945.60 |
1.1589 times |
Thu 16 October 2025 |
1946.70 (1.84%) |
1932.10 |
1917.30 - 1978.60 |
1.1661 times |
Wed 15 October 2025 |
1911.50 (-0.38%) |
1917.00 |
1906.00 - 1948.70 |
1.1726 times |
Tue 14 October 2025 |
1918.70 (-1.91%) |
1959.90 |
1911.10 - 1964.00 |
0.9199 times |
Mon 13 October 2025 |
1956.00 (-0.58%) |
1960.00 |
1941.00 - 1965.80 |
0.9176 times |
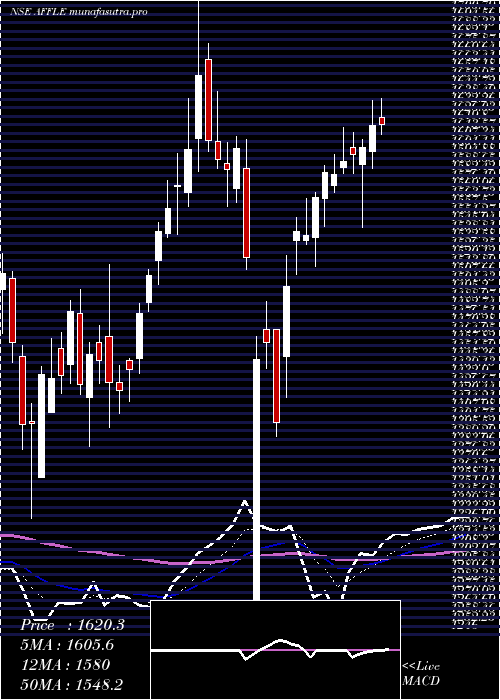
Weekly price and charts AffleIndia Strong weekly Stock price targets for AffleIndia AFFLE are 1903.1 and 1970.9 | Weekly Target 1 | 1851.6 | | Weekly Target 2 | 1886.8 | | Weekly Target 3 | 1919.4 | | Weekly Target 4 | 1954.6 | | Weekly Target 5 | 1987.2 |
Weekly price and volumes for Affle India
| Date |
Closing |
Open |
Range |
Volume |
Tue 28 October 2025 |
1922.00 (1.83%) |
1887.40 |
1884.20 - 1952.00 |
0.2163 times |
Fri 24 October 2025 |
1887.40 (-0.25%) |
1896.00 |
1863.00 - 1935.90 |
0.4003 times |
Fri 17 October 2025 |
1892.10 (-3.83%) |
1960.00 |
1889.00 - 1978.60 |
0.5893 times |
Fri 10 October 2025 |
1967.40 (1.49%) |
1936.70 |
1878.80 - 1993.70 |
0.8521 times |
Fri 03 October 2025 |
1938.60 (-3.38%) |
2013.20 |
1915.60 - 2016.70 |
0.5706 times |
Fri 26 September 2025 |
2006.40 (-6.47%) |
2143.10 |
1985.20 - 2185.90 |
0.8762 times |
Fri 19 September 2025 |
2145.20 (3.34%) |
2083.00 |
2034.40 - 2185.00 |
1.574 times |
Fri 12 September 2025 |
2075.90 (7.59%) |
1935.20 |
1925.60 - 2133.70 |
3.0399 times |
Fri 05 September 2025 |
1929.40 (1.14%) |
1900.00 |
1885.50 - 1954.90 |
1.3471 times |
Fri 29 August 2025 |
1907.60 (-2.09%) |
1955.00 |
1872.10 - 1958.20 |
0.5342 times |
Fri 22 August 2025 |
1948.40 (-0.83%) |
1976.00 |
1910.00 - 2002.00 |
0.6213 times |
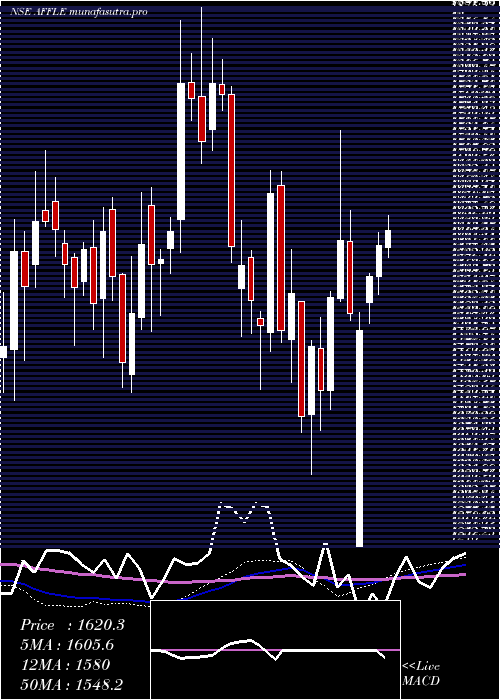
Monthly price and charts AffleIndia Strong monthly Stock price targets for AffleIndia AFFLE are 1827.15 and 1957.85 | Monthly Target 1 | 1795.53 | | Monthly Target 2 | 1858.77 | | Monthly Target 3 | 1926.2333333333 | | Monthly Target 4 | 1989.47 | | Monthly Target 5 | 2056.93 |
Monthly price and volumes Affle India
| Date |
Closing |
Open |
Range |
Volume |
Tue 28 October 2025 |
1922.00 (-1.32%) |
1947.70 |
1863.00 - 1993.70 |
0.4868 times |
Tue 30 September 2025 |
1947.70 (2.1%) |
1900.00 |
1885.50 - 2185.90 |
1.5199 times |
Fri 29 August 2025 |
1907.60 (-2.57%) |
1949.80 |
1872.10 - 2010.00 |
0.5945 times |
Thu 31 July 2025 |
1958.00 (-2.02%) |
1998.30 |
1773.00 - 2080.00 |
1.0534 times |
Mon 30 June 2025 |
1998.30 (15.14%) |
1740.00 |
1730.00 - 2040.00 |
1.4263 times |
Fri 30 May 2025 |
1735.60 (9.57%) |
1565.50 |
1485.00 - 1800.00 |
0.8901 times |
Wed 30 April 2025 |
1584.00 (-1.53%) |
1607.95 |
1246.00 - 1644.45 |
0.7103 times |
Fri 28 March 2025 |
1608.55 (14.88%) |
1402.15 |
1331.25 - 1738.80 |
0.9202 times |
Fri 28 February 2025 |
1400.25 (-7.14%) |
1500.00 |
1381.85 - 1691.90 |
1.5344 times |
Fri 31 January 2025 |
1507.95 (-15.44%) |
1780.10 |
1432.40 - 1822.75 |
0.8641 times |
Tue 31 December 2024 |
1783.25 (10.13%) |
1634.00 |
1595.05 - 1884.00 |
2.3923 times |

DMA SMA EMA moving averages of Affle India AFFLE
DMA (daily moving average) of Affle India AFFLE
| DMA period | DMA value | | 5 day DMA | 1902.08 | | 12 day DMA | 1915.77 | | 20 day DMA | 1925.71 | | 35 day DMA | 1988.15 | | 50 day DMA | 1969.24 | | 100 day DMA | 1952.62 | | 150 day DMA | 1839.24 | | 200 day DMA | 1760.42 | EMA (exponential moving average) of Affle India AFFLE
| EMA period | EMA current | EMA prev | EMA prev2 | | 5 day EMA | 1909.92 | 1903.88 | 1896.02 | | 12 day EMA | 1917.79 | 1917.03 | 1916.56 | | 20 day EMA | 1933.76 | 1935 | 1936.62 | | 35 day EMA | 1943.93 | 1945.22 | 1946.73 | | 50 day EMA | 1963.02 | 1964.69 | 1966.53 |
SMA (simple moving average) of Affle India AFFLE
| SMA period | SMA current | SMA prev | SMA prev2 | | 5 day SMA | 1902.08 | 1894.96 | 1889.46 | | 12 day SMA | 1915.77 | 1918.72 | 1919.97 | | 20 day SMA | 1925.71 | 1929.93 | 1937.09 | | 35 day SMA | 1988.15 | 1988.36 | 1987.99 | | 50 day SMA | 1969.24 | 1970.47 | 1971.67 | | 100 day SMA | 1952.62 | 1951.43 | 1950.11 | | 150 day SMA | 1839.24 | 1836.3 | 1833.1 | | 200 day SMA | 1760.42 | 1759.35 | 1758.66 |
|
|
