AeroflexIndustries AEROFLEX full analysis,charts,indicators,moving averages,SMA,DMA,EMA,ADX,MACD,RSIAeroflex Industries AEROFLEX WideScreen charts, DMA,SMA,EMA technical analysis, forecast prediction, by indicators ADX,MACD,RSI,CCI NSE stock exchange
Daily price and charts and targets AeroflexIndustries Strong Daily Stock price targets for AeroflexIndustries AEROFLEX are 179.88 and 188.98 | Daily Target 1 | 178.09 | | Daily Target 2 | 181.67 | | Daily Target 3 | 187.18666666667 | | Daily Target 4 | 190.77 | | Daily Target 5 | 196.29 |
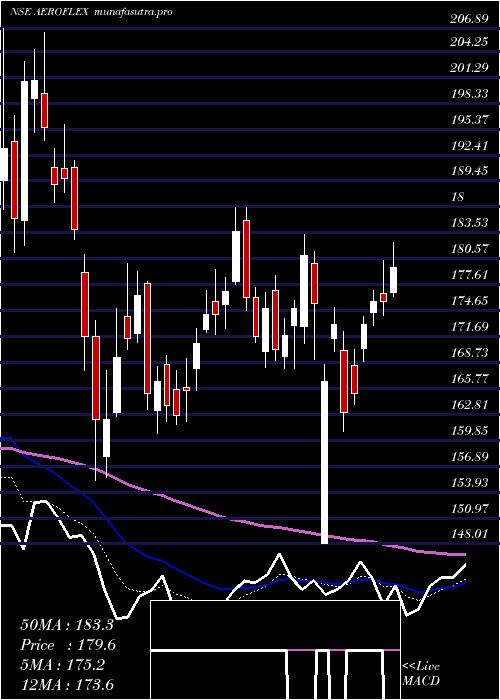
Daily price and volume Aeroflex Industries
| Date |
Closing |
Open |
Range |
Volume |
Wed 29 October 2025 |
185.26 (0.4%) |
185.95 |
183.60 - 192.70 |
2.7759 times |
Tue 28 October 2025 |
184.53 (6.57%) |
173.00 |
173.00 - 189.79 |
4.2691 times |
Mon 27 October 2025 |
173.16 (0.48%) |
173.30 |
170.24 - 176.00 |
0.3108 times |
Fri 24 October 2025 |
172.33 (-0.06%) |
171.60 |
171.50 - 174.17 |
0.2359 times |
Thu 23 October 2025 |
172.43 (0.84%) |
173.45 |
169.98 - 176.67 |
0.8628 times |
Tue 21 October 2025 |
170.99 (2.13%) |
168.90 |
168.00 - 172.00 |
0.1369 times |
Mon 20 October 2025 |
167.43 (-1.18%) |
170.80 |
166.10 - 170.95 |
0.5143 times |
Fri 17 October 2025 |
169.43 (-0.37%) |
170.80 |
169.00 - 170.80 |
0.2359 times |
Thu 16 October 2025 |
170.06 (0.48%) |
169.95 |
169.50 - 172.42 |
0.3399 times |
Wed 15 October 2025 |
169.24 (-0.04%) |
169.93 |
168.49 - 170.70 |
0.3184 times |
Tue 14 October 2025 |
169.30 (-0.9%) |
170.84 |
167.95 - 172.30 |
0.4567 times |
Weekly price and charts AeroflexIndustries Strong weekly Stock price targets for AeroflexIndustries AEROFLEX are 177.75 and 200.21 | Weekly Target 1 | 160.27 | | Weekly Target 2 | 172.77 | | Weekly Target 3 | 182.73333333333 | | Weekly Target 4 | 195.23 | | Weekly Target 5 | 205.19 |
Weekly price and volumes for Aeroflex Industries
| Date |
Closing |
Open |
Range |
Volume |
Wed 29 October 2025 |
185.26 (7.5%) |
173.30 |
170.24 - 192.70 |
2.1014 times |
Fri 24 October 2025 |
172.33 (1.71%) |
170.80 |
166.10 - 176.67 |
0.4999 times |
Fri 17 October 2025 |
169.43 (-2.07%) |
172.78 |
167.95 - 172.78 |
0.5059 times |
Fri 10 October 2025 |
173.01 (-3.63%) |
179.95 |
172.00 - 181.25 |
0.6362 times |
Fri 03 October 2025 |
179.53 (-0.16%) |
183.00 |
173.00 - 183.00 |
0.5853 times |
Fri 26 September 2025 |
179.81 (-5%) |
188.50 |
178.80 - 198.75 |
1.2974 times |
Fri 19 September 2025 |
189.28 (7.61%) |
175.90 |
175.90 - 194.30 |
2.0519 times |
Fri 12 September 2025 |
175.90 (-1.36%) |
178.79 |
175.00 - 181.71 |
0.69 times |
Fri 05 September 2025 |
178.32 (4.64%) |
171.00 |
170.00 - 183.29 |
0.781 times |
Fri 29 August 2025 |
170.42 (-5.85%) |
181.45 |
168.10 - 183.50 |
0.851 times |
Fri 22 August 2025 |
181.01 (-1.84%) |
187.00 |
179.54 - 189.40 |
0.7628 times |

Monthly price and charts AeroflexIndustries Strong monthly Stock price targets for AeroflexIndustries AEROFLEX are 175.68 and 202.28 | Monthly Target 1 | 154.75 | | Monthly Target 2 | 170.01 | | Monthly Target 3 | 181.35333333333 | | Monthly Target 4 | 196.61 | | Monthly Target 5 | 207.95 |
Monthly price and volumes Aeroflex Industries
| Date |
Closing |
Open |
Range |
Volume |
Wed 29 October 2025 |
185.26 (6.32%) |
174.99 |
166.10 - 192.70 |
0.2326 times |
Tue 30 September 2025 |
174.24 (2.24%) |
171.00 |
170.00 - 198.75 |
0.2883 times |
Fri 29 August 2025 |
170.42 (-9.84%) |
188.11 |
168.10 - 194.09 |
0.2884 times |
Thu 31 July 2025 |
189.03 (-11.15%) |
213.95 |
186.25 - 227.00 |
1.2975 times |
Mon 30 June 2025 |
212.76 (28.26%) |
166.25 |
161.07 - 217.45 |
4.4933 times |
Fri 30 May 2025 |
165.88 (-5.6%) |
171.50 |
152.10 - 173.02 |
0.2753 times |
Wed 30 April 2025 |
175.72 (3.26%) |
169.41 |
148.01 - 185.25 |
0.3156 times |
Fri 28 March 2025 |
170.17 (-0.92%) |
171.75 |
155.22 - 186.49 |
0.414 times |
Fri 28 February 2025 |
171.75 (-29.22%) |
246.00 |
167.80 - 272.00 |
0.7732 times |
Fri 31 January 2025 |
242.65 (20.07%) |
201.00 |
175.00 - 262.55 |
1.6219 times |
Tue 31 December 2024 |
202.09 (-5.51%) |
226.00 |
196.95 - 234.45 |
0.6858 times |

DMA SMA EMA moving averages of Aeroflex Industries AEROFLEX
DMA (daily moving average) of Aeroflex Industries AEROFLEX
| DMA period | DMA value | | 5 day DMA | 177.54 | | 12 day DMA | 172.92 | | 20 day DMA | 173.78 | | 35 day DMA | 177.86 | | 50 day DMA | 178.14 | | 100 day DMA | 185.93 | | 150 day DMA | 180.58 | | 200 day DMA | 186.5 | EMA (exponential moving average) of Aeroflex Industries AEROFLEX
| EMA period | EMA current | EMA prev | EMA prev2 | | 5 day EMA | 179.15 | 176.1 | 171.89 | | 12 day EMA | 175.81 | 174.09 | 172.19 | | 20 day EMA | 175.7 | 174.69 | 173.65 | | 35 day EMA | 176.35 | 175.83 | 175.32 | | 50 day EMA | 178.44 | 178.16 | 177.9 |
SMA (simple moving average) of Aeroflex Industries AEROFLEX
| SMA period | SMA current | SMA prev | SMA prev2 | | 5 day SMA | 177.54 | 174.69 | 171.27 | | 12 day SMA | 172.92 | 171.9 | 170.94 | | 20 day SMA | 173.78 | 173.29 | 173.06 | | 35 day SMA | 177.86 | 177.66 | 177.48 | | 50 day SMA | 178.14 | 178.12 | 178.15 | | 100 day SMA | 185.93 | 185.71 | 185.5 | | 150 day SMA | 180.58 | 180.51 | 180.44 | | 200 day SMA | 186.5 | 186.61 | 186.69 |
|
|
