AndhraCements ACL_BE full analysis,charts,indicators,moving averages,SMA,DMA,EMA,ADX,MACD,RSIAndhra Cements ACL_BE WideScreen charts, DMA,SMA,EMA technical analysis, forecast prediction, by indicators ADX,MACD,RSI,CCI NSE stock exchange
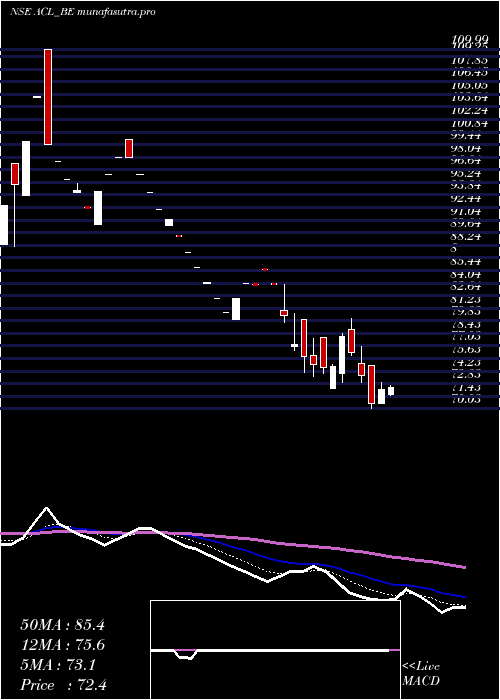
Daily price and charts and targets AndhraCements Strong Daily Stock price targets for AndhraCements ACL_BE are 71.98 and 73.02 | Daily Target 1 | 71.15 | | Daily Target 2 | 71.77 | | Daily Target 3 | 72.193333333333 | | Daily Target 4 | 72.81 | | Daily Target 5 | 73.23 |
Daily price and volume Andhra Cements
| Date |
Closing |
Open |
Range |
Volume |
Wed 29 October 2025 |
72.38 (0.25%) |
71.60 |
71.58 - 72.62 |
0.2977 times |
Tue 28 October 2025 |
72.20 (2.15%) |
70.68 |
70.68 - 73.00 |
0.7317 times |
Mon 27 October 2025 |
70.68 (-4.12%) |
74.86 |
70.03 - 74.86 |
2.1996 times |
Fri 24 October 2025 |
73.72 (-3.37%) |
75.10 |
73.01 - 77.00 |
1.1098 times |
Thu 23 October 2025 |
76.29 (-2.36%) |
78.90 |
76.00 - 80.08 |
1.6155 times |
Tue 21 October 2025 |
78.13 (4.56%) |
74.00 |
73.00 - 78.44 |
0.5667 times |
Mon 20 October 2025 |
74.72 (0.11%) |
72.30 |
72.30 - 75.00 |
0.3443 times |
Fri 17 October 2025 |
74.64 (-0.47%) |
77.95 |
74.00 - 77.95 |
0.6828 times |
Thu 16 October 2025 |
74.99 (-1.21%) |
76.01 |
73.62 - 77.90 |
1.6952 times |
Wed 15 October 2025 |
75.91 (-1.68%) |
79.98 |
74.05 - 79.98 |
0.7565 times |
Tue 14 October 2025 |
77.21 (-4%) |
77.03 |
76.51 - 80.60 |
1.7146 times |
Weekly price and charts AndhraCements Strong weekly Stock price targets for AndhraCements ACL_BE are 68.79 and 73.62 | Weekly Target 1 | 67.59 | | Weekly Target 2 | 69.99 | | Weekly Target 3 | 72.423333333333 | | Weekly Target 4 | 74.82 | | Weekly Target 5 | 77.25 |
Weekly price and volumes for Andhra Cements
| Date |
Closing |
Open |
Range |
Volume |
Wed 29 October 2025 |
72.38 (-1.82%) |
74.86 |
70.03 - 74.86 |
0.2367 times |
Fri 24 October 2025 |
73.72 (-1.23%) |
72.30 |
72.30 - 80.08 |
0.2666 times |
Fri 17 October 2025 |
74.64 (-10.96%) |
81.00 |
73.62 - 83.83 |
0.5326 times |
Fri 10 October 2025 |
83.83 (3.87%) |
80.00 |
80.00 - 85.57 |
0.5405 times |
Fri 03 October 2025 |
80.71 (-7.74%) |
85.73 |
80.71 - 85.73 |
0.2131 times |
Fri 26 September 2025 |
87.48 (-8.96%) |
94.16 |
87.48 - 94.16 |
0.303 times |
Fri 19 September 2025 |
96.09 (3.98%) |
90.56 |
90.56 - 100.01 |
1.0889 times |
Fri 12 September 2025 |
92.41 (-11.79%) |
109.99 |
92.41 - 109.99 |
1.8891 times |
Fri 05 September 2025 |
104.76 (7.61%) |
83.00 |
81.13 - 104.76 |
4.6855 times |
Fri 29 September 2023 |
97.35 (-2.31%) |
100.00 |
95.60 - 101.35 |
0.2441 times |
Fri 22 September 2023 |
99.65 (0.91%) |
102.30 |
96.00 - 102.30 |
0.229 times |
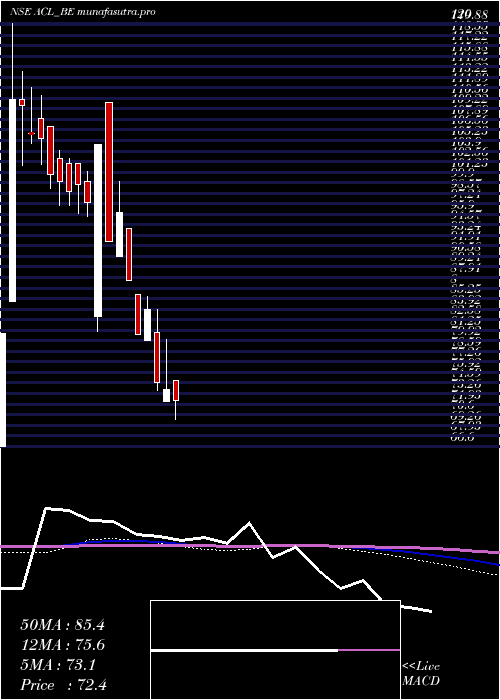
Monthly price and charts AndhraCements Strong monthly Stock price targets for AndhraCements ACL_BE are 63.44 and 78.98 | Monthly Target 1 | 60.45 | | Monthly Target 2 | 66.42 | | Monthly Target 3 | 75.993333333333 | | Monthly Target 4 | 81.96 | | Monthly Target 5 | 91.53 |
Monthly price and volumes Andhra Cements
| Date |
Closing |
Open |
Range |
Volume |
Wed 29 October 2025 |
72.38 (-13.88%) |
82.36 |
70.03 - 85.57 |
0.4573 times |
Tue 30 September 2025 |
84.05 (-18.2%) |
103.75 |
81.13 - 109.99 |
2.6363 times |
Thu 31 August 2023 |
102.75 (15.38%) |
114.00 |
99.55 - 120.00 |
0.8192 times |
Tue 23 May 2023 |
89.05 (0%) |
54.90 |
54.90 - 89.05 |
0.0871 times |
Wed 29 October 2025 |
(0%) |
|
- |
0 times |

DMA SMA EMA moving averages of Andhra Cements ACL_BE
DMA (daily moving average) of Andhra Cements ACL_BE
| DMA period | DMA value | | 5 day DMA | 73.05 | | 12 day DMA | 75.11 | | 20 day DMA | 78.4 | | 35 day DMA | 84.87 | | 50 day DMA | 88.69 | | 100 day DMA | | | 150 day DMA | | | 200 day DMA | | EMA (exponential moving average) of Andhra Cements ACL_BE
| EMA period | EMA current | EMA prev | EMA prev2 | | 5 day EMA | 73.05 | 73.39 | 73.99 | | 12 day EMA | 75.6 | 76.19 | 76.91 | | 20 day EMA | 78.51 | 79.16 | 79.89 | | 35 day EMA | 83.12 | 83.75 | 84.43 | | 50 day EMA | 87.98 | 88.62 | 89.29 |
SMA (simple moving average) of Andhra Cements ACL_BE
| SMA period | SMA current | SMA prev | SMA prev2 | | 5 day SMA | 73.05 | 74.2 | 74.71 | | 12 day SMA | 75.11 | 76.06 | 77.18 | | 20 day SMA | 78.4 | 79.06 | 79.83 | | 35 day SMA | 84.87 | 85.64 | 86.57 | | 50 day SMA | 88.69 | 89.22 | 89.75 | | 100 day SMA | | 150 day SMA | | 200 day SMA |
|
|
