ActionConstruction ACE full analysis,charts,indicators,moving averages,SMA,DMA,EMA,ADX,MACD,RSIAction Construction ACE WideScreen charts, DMA,SMA,EMA technical analysis, forecast prediction, by indicators ADX,MACD,RSI,CCI NSE stock exchange
operates under Transport Related Services sector
Daily price and charts and targets ActionConstruction Strong Daily Stock price targets for ActionConstruction ACE are 1056.9 and 1103.8 | Daily Target 1 | 1048.3 | | Daily Target 2 | 1065.5 | | Daily Target 3 | 1095.2 | | Daily Target 4 | 1112.4 | | Daily Target 5 | 1142.1 |
Daily price and volume Action Construction
| Date |
Closing |
Open |
Range |
Volume |
Tue 28 October 2025 |
1082.70 (-2.83%) |
1114.40 |
1078.00 - 1124.90 |
1.4357 times |
Mon 27 October 2025 |
1114.20 (0.37%) |
1109.50 |
1103.90 - 1121.40 |
0.9427 times |
Fri 24 October 2025 |
1110.10 (0.83%) |
1098.30 |
1096.50 - 1121.40 |
0.7274 times |
Thu 23 October 2025 |
1101.00 (-1.43%) |
1120.00 |
1094.30 - 1123.90 |
1.1647 times |
Tue 21 October 2025 |
1117.00 (0.4%) |
1112.00 |
1110.00 - 1125.00 |
0.3047 times |
Mon 20 October 2025 |
1112.50 (2.4%) |
1086.40 |
1085.20 - 1116.00 |
1.3903 times |
Fri 17 October 2025 |
1086.40 (0.89%) |
1077.00 |
1076.80 - 1089.40 |
0.7261 times |
Thu 16 October 2025 |
1076.80 (0.14%) |
1075.00 |
1072.20 - 1093.40 |
0.9402 times |
Wed 15 October 2025 |
1075.30 (-0.69%) |
1079.80 |
1071.00 - 1094.50 |
1.0242 times |
Tue 14 October 2025 |
1082.80 (0.13%) |
1080.80 |
1071.00 - 1101.40 |
1.344 times |
Mon 13 October 2025 |
1081.40 (1.16%) |
1066.90 |
1061.00 - 1094.20 |
1.1322 times |
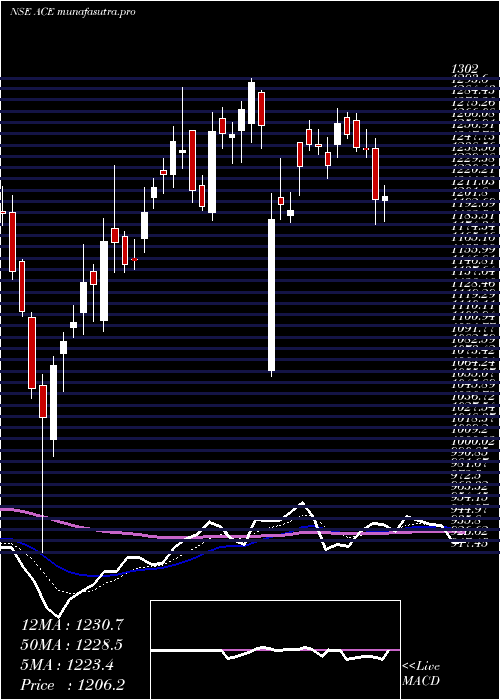
Weekly price and charts ActionConstruction Strong weekly Stock price targets for ActionConstruction ACE are 1056.9 and 1103.8 | Weekly Target 1 | 1048.3 | | Weekly Target 2 | 1065.5 | | Weekly Target 3 | 1095.2 | | Weekly Target 4 | 1112.4 | | Weekly Target 5 | 1142.1 |
Weekly price and volumes for Action Construction
| Date |
Closing |
Open |
Range |
Volume |
Tue 28 October 2025 |
1082.70 (-2.47%) |
1109.50 |
1078.00 - 1124.90 |
0.1449 times |
Fri 24 October 2025 |
1110.10 (2.18%) |
1086.40 |
1085.20 - 1125.00 |
0.2185 times |
Fri 17 October 2025 |
1086.40 (1.63%) |
1066.90 |
1061.00 - 1101.40 |
0.3148 times |
Fri 10 October 2025 |
1069.00 (-0.72%) |
1078.00 |
1064.00 - 1097.70 |
0.2242 times |
Fri 03 October 2025 |
1076.80 (-0.31%) |
1081.00 |
1049.00 - 1104.40 |
0.2296 times |
Fri 26 September 2025 |
1080.10 (-6.08%) |
1150.10 |
1075.50 - 1167.00 |
0.4104 times |
Fri 19 September 2025 |
1150.00 (2.78%) |
1122.00 |
1109.00 - 1170.00 |
0.583 times |
Fri 12 September 2025 |
1118.90 (5.9%) |
1059.20 |
1056.60 - 1158.50 |
2.5363 times |
Fri 05 September 2025 |
1056.60 (0.29%) |
1060.30 |
1040.00 - 1120.00 |
0.611 times |
Fri 29 August 2025 |
1053.50 (6.91%) |
995.60 |
991.60 - 1103.90 |
4.7273 times |
Fri 22 August 2025 |
985.40 (5.68%) |
948.00 |
938.30 - 1017.00 |
0.8898 times |
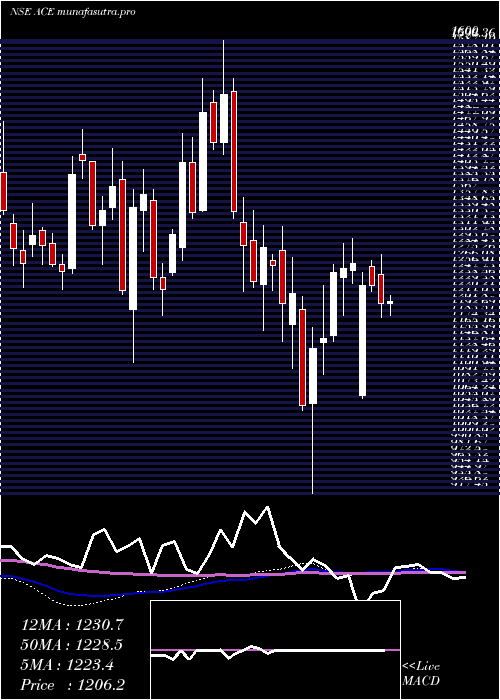
Monthly price and charts ActionConstruction Strong monthly Stock price targets for ActionConstruction ACE are 1065.85 and 1141.85 | Monthly Target 1 | 1009.57 | | Monthly Target 2 | 1046.13 | | Monthly Target 3 | 1085.5666666667 | | Monthly Target 4 | 1122.13 | | Monthly Target 5 | 1161.57 |
Monthly price and volumes Action Construction
| Date |
Closing |
Open |
Range |
Volume |
Tue 28 October 2025 |
1082.70 (0.94%) |
1067.00 |
1049.00 - 1125.00 |
0.3771 times |
Tue 30 September 2025 |
1072.60 (1.81%) |
1060.30 |
1040.00 - 1170.00 |
1.5752 times |
Fri 29 August 2025 |
1053.50 (-6.98%) |
1132.00 |
930.00 - 1141.00 |
2.6277 times |
Thu 31 July 2025 |
1132.50 (-7.07%) |
1218.60 |
1077.70 - 1227.80 |
0.4321 times |
Mon 30 June 2025 |
1218.60 (-2.41%) |
1253.60 |
1156.90 - 1277.00 |
0.5351 times |
Fri 30 May 2025 |
1248.70 (6.86%) |
1175.00 |
1140.00 - 1389.00 |
1.1847 times |
Wed 30 April 2025 |
1168.50 (-7.05%) |
1254.00 |
1060.05 - 1302.00 |
0.4435 times |
Fri 28 March 2025 |
1257.10 (19.69%) |
1052.55 |
917.45 - 1294.35 |
1.0836 times |
Fri 28 February 2025 |
1050.30 (-18.45%) |
1267.90 |
1042.05 - 1319.85 |
0.7632 times |
Fri 31 January 2025 |
1288.00 (-14.55%) |
1506.00 |
1163.40 - 1600.00 |
0.9777 times |
Tue 31 December 2024 |
1507.40 (15.24%) |
1288.50 |
1268.95 - 1542.00 |
1.7116 times |

DMA SMA EMA moving averages of Action Construction ACE
DMA (daily moving average) of Action Construction ACE
| DMA period | DMA value | | 5 day DMA | 1105 | | 12 day DMA | 1092.43 | | 20 day DMA | 1086.63 | | 35 day DMA | 1102.6 | | 50 day DMA | 1081.72 | | 100 day DMA | 1121.15 | | 150 day DMA | 1159.25 | | 200 day DMA | 1175.2 | EMA (exponential moving average) of Action Construction ACE
| EMA period | EMA current | EMA prev | EMA prev2 | | 5 day EMA | 1098.95 | 1107.07 | 1103.51 | | 12 day EMA | 1096.32 | 1098.79 | 1095.99 | | 20 day EMA | 1093.96 | 1095.14 | 1093.14 | | 35 day EMA | 1083.47 | 1083.52 | 1081.71 | | 50 day EMA | 1078.49 | 1078.32 | 1076.86 |
SMA (simple moving average) of Action Construction ACE
| SMA period | SMA current | SMA prev | SMA prev2 | | 5 day SMA | 1105 | 1110.96 | 1105.4 | | 12 day SMA | 1092.43 | 1091.49 | 1089.09 | | 20 day SMA | 1086.63 | 1086.5 | 1086.49 | | 35 day SMA | 1102.6 | 1101.86 | 1100.66 | | 50 day SMA | 1081.72 | 1078.86 | 1075.45 | | 100 day SMA | 1121.15 | 1122.99 | 1124.38 | | 150 day SMA | 1159.25 | 1160.12 | 1160.64 | | 200 day SMA | 1175.2 | 1177.01 | 1179.03 |
|
|
