AbmInternational ABMINTLLTD_BE full analysis,charts,indicators,moving averages,SMA,DMA,EMA,ADX,MACD,RSIAbm International ABMINTLLTD_BE WideScreen charts, DMA,SMA,EMA technical analysis, forecast prediction, by indicators ADX,MACD,RSI,CCI NSE stock exchange
Daily price and charts and targets AbmInternational Strong Daily Stock price targets for AbmInternational ABMINTLLTD_BE are 51.21 and 51.21 | Daily Target 1 | 51.21 | | Daily Target 2 | 51.21 | | Daily Target 3 | 51.21 | | Daily Target 4 | 51.21 | | Daily Target 5 | 51.21 |
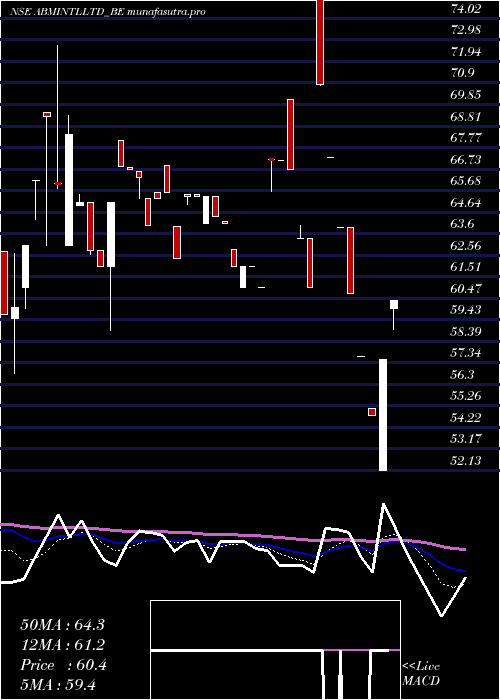
Daily price and volume Abm International
| Date |
Closing |
Open |
Range |
Volume |
Tue 28 October 2025 |
51.21 (0.02%) |
51.21 |
51.21 - 51.21 |
0.0183 times |
Mon 27 October 2025 |
51.20 (-3.83%) |
50.61 |
50.61 - 53.00 |
0.0733 times |
Fri 24 October 2025 |
53.24 (-5%) |
58.84 |
53.23 - 58.84 |
2.1661 times |
Thu 23 October 2025 |
56.04 (4.98%) |
56.04 |
56.04 - 56.04 |
2.74 times |
Tue 21 October 2025 |
53.38 (4.93%) |
53.41 |
53.00 - 53.41 |
0.3557 times |
Mon 20 October 2025 |
50.87 (4.99%) |
50.00 |
50.00 - 50.87 |
0.5907 times |
Fri 17 October 2025 |
48.45 (-3.1%) |
50.00 |
47.50 - 52.50 |
1.212 times |
Thu 16 October 2025 |
50.00 (18.09%) |
54.00 |
50.00 - 54.00 |
1.3983 times |
Fri 03 October 2025 |
42.34 (4.98%) |
41.14 |
41.14 - 42.34 |
0.6854 times |
Wed 01 October 2025 |
40.33 (5%) |
37.01 |
37.01 - 40.33 |
0.7602 times |
Tue 30 September 2025 |
38.41 (-2.07%) |
38.27 |
38.27 - 39.00 |
1.6242 times |
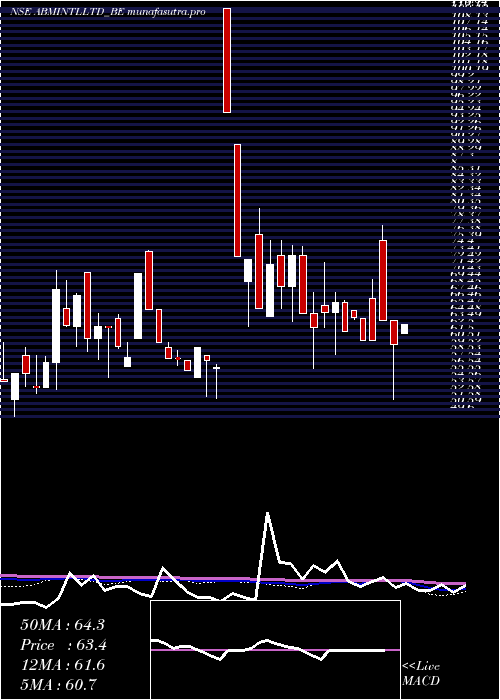
Weekly price and charts AbmInternational Strong weekly Stock price targets for AbmInternational ABMINTLLTD_BE are 50.91 and 53.3 | Weekly Target 1 | 49.22 | | Weekly Target 2 | 50.21 | | Weekly Target 3 | 51.606666666667 | | Weekly Target 4 | 52.6 | | Weekly Target 5 | 54 |
Weekly price and volumes for Abm International
| Date |
Closing |
Open |
Range |
Volume |
Tue 28 October 2025 |
51.21 (-3.81%) |
50.61 |
50.61 - 53.00 |
0.0257 times |
Fri 24 October 2025 |
53.24 (9.89%) |
50.00 |
50.00 - 58.84 |
1.6419 times |
Fri 17 October 2025 |
48.45 (14.43%) |
54.00 |
47.50 - 54.00 |
0.7323 times |
Fri 03 October 2025 |
42.34 (3.17%) |
38.98 |
37.01 - 42.34 |
0.8698 times |
Fri 26 September 2025 |
41.04 (-1.51%) |
42.50 |
38.98 - 42.50 |
0.4514 times |
Fri 19 September 2025 |
41.67 (-7.91%) |
45.25 |
40.85 - 46.38 |
1.6295 times |
Fri 12 September 2025 |
45.25 (-1.42%) |
46.12 |
42.78 - 47.25 |
1.5867 times |
Fri 05 September 2025 |
45.90 (10.07%) |
40.65 |
40.65 - 47.25 |
0.6895 times |
Fri 29 August 2025 |
41.70 (-9.49%) |
45.85 |
39.62 - 45.85 |
1.5109 times |
Fri 22 August 2025 |
46.07 (-8.04%) |
49.85 |
46.07 - 49.85 |
0.8625 times |
Thu 14 August 2025 |
50.10 (-6.36%) |
52.43 |
50.10 - 52.43 |
0.421 times |
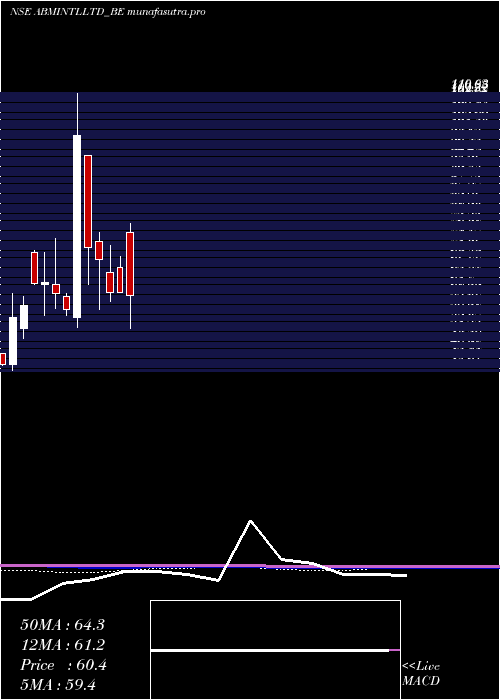
Monthly price and charts AbmInternational Strong monthly Stock price targets for AbmInternational ABMINTLLTD_BE are 44.11 and 65.94 | Monthly Target 1 | 27.19 | | Monthly Target 2 | 39.2 | | Monthly Target 3 | 49.02 | | Monthly Target 4 | 61.03 | | Monthly Target 5 | 70.85 |
Monthly price and volumes Abm International
| Date |
Closing |
Open |
Range |
Volume |
Tue 28 October 2025 |
51.21 (33.32%) |
37.01 |
37.01 - 58.84 |
0.3267 times |
Tue 30 September 2025 |
38.41 (-7.89%) |
40.65 |
38.27 - 47.25 |
0.5614 times |
Fri 29 August 2025 |
41.70 (-29.8%) |
59.21 |
39.62 - 59.21 |
0.3525 times |
Tue 29 July 2025 |
59.40 (-2.62%) |
76.00 |
52.13 - 78.21 |
2.8299 times |
Fri 07 February 2025 |
61.00 (0%) |
67.21 |
61.00 - 70.10 |
0.0591 times |
Fri 31 January 2025 |
61.00 (-11.91%) |
66.02 |
58.90 - 72.70 |
0.6446 times |
Tue 31 December 2024 |
69.25 (-4.19%) |
73.73 |
56.80 - 75.89 |
2.0723 times |
Fri 29 November 2024 |
72.28 (-27.78%) |
95.08 |
63.05 - 95.08 |
2.0554 times |
Thu 31 October 2024 |
100.09 (75.91%) |
55.00 |
52.34 - 110.62 |
0.6988 times |
Mon 30 September 2024 |
56.90 (-6.35%) |
60.00 |
55.41 - 60.76 |
0.3994 times |
Fri 30 August 2024 |
60.76 (-4.31%) |
63.00 |
57.10 - 74.50 |
0.8695 times |
DMA SMA EMA moving averages of Abm International ABMINTLLTD_BE
DMA (daily moving average) of Abm International ABMINTLLTD_BE
| DMA period | DMA value | | 5 day DMA | 53.01 | | 12 day DMA | 47.89 | | 20 day DMA | 45.39 | | 35 day DMA | 44.86 | | 50 day DMA | 46.73 | | 100 day DMA | 55.07 | | 150 day DMA | 59.61 | | 200 day DMA | 60.03 | EMA (exponential moving average) of Abm International ABMINTLLTD_BE
| EMA period | EMA current | EMA prev | EMA prev2 | | 5 day EMA | 51.6 | 51.8 | 52.1 | | 12 day EMA | 49.23 | 48.87 | 48.45 | | 20 day EMA | 47.74 | 47.38 | 46.98 | | 35 day EMA | 47.64 | 47.43 | 47.21 | | 50 day EMA | 48.38 | 48.26 | 48.14 |
SMA (simple moving average) of Abm International ABMINTLLTD_BE
| SMA period | SMA current | SMA prev | SMA prev2 | | 5 day SMA | 53.01 | 52.95 | 52.4 | | 12 day SMA | 47.89 | 47.04 | 46.2 | | 20 day SMA | 45.39 | 45.1 | 44.8 | | 35 day SMA | 44.86 | 44.68 | 44.54 | | 50 day SMA | 46.73 | 46.89 | 47.05 | | 100 day SMA | 55.07 | 55.19 | 55.28 | | 150 day SMA | 59.61 | 59.65 | 59.69 | | 200 day SMA | 60.03 | 60.09 | 60.15 |
|
|
