AbmInternational ABMINTLLTD full analysis,charts,indicators,moving averages,SMA,DMA,EMA,ADX,MACD,RSIAbm International ABMINTLLTD WideScreen charts, DMA,SMA,EMA technical analysis, forecast prediction, by indicators ADX,MACD,RSI,CCI NSE stock exchange
Daily price and charts and targets AbmInternational Strong Daily Stock price targets for AbmInternational ABMINTLLTD are 40.25 and 45.53 | Daily Target 1 | 39.28 | | Daily Target 2 | 41.22 | | Daily Target 3 | 44.556666666667 | | Daily Target 4 | 46.5 | | Daily Target 5 | 49.84 |
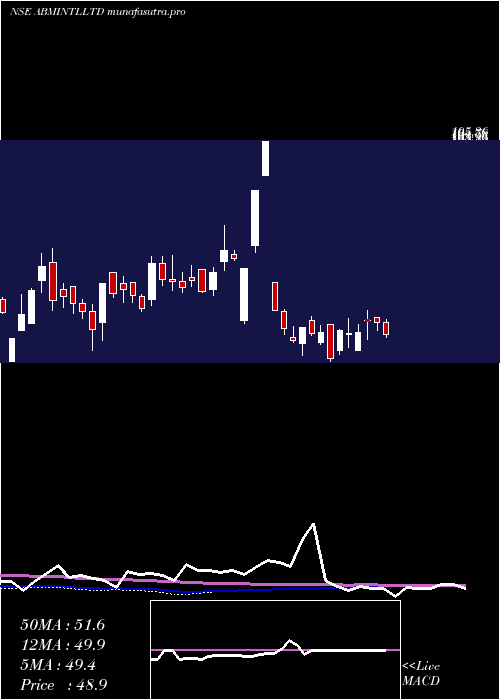
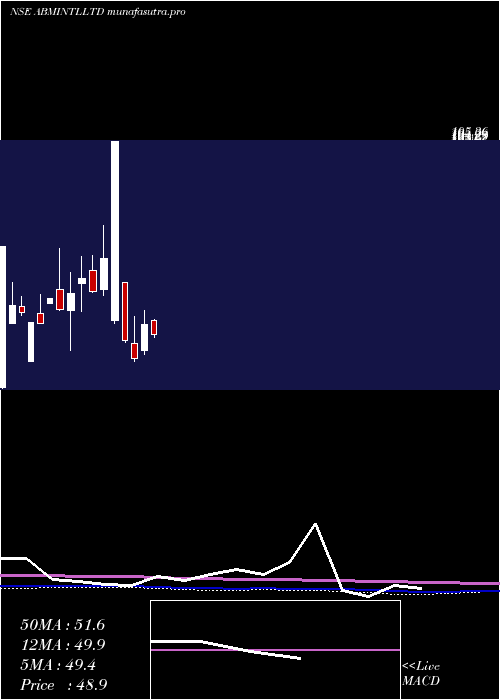
Daily price and volume Abm International
| Date |
Closing |
Open |
Range |
Volume |
Wed 10 December 2025 |
43.17 (-3.96%) |
44.00 |
42.61 - 47.89 |
1.1874 times |
Tue 09 December 2025 |
44.95 (-2.15%) |
44.79 |
44.00 - 44.95 |
0.0174 times |
Mon 08 December 2025 |
45.94 (1.95%) |
46.99 |
45.94 - 46.99 |
0.0023 times |
Fri 05 December 2025 |
45.06 (5.23%) |
39.60 |
39.60 - 46.80 |
2.1868 times |
Thu 04 December 2025 |
42.82 (-0.67%) |
43.11 |
41.20 - 44.90 |
0.7097 times |
Wed 03 December 2025 |
43.11 (0%) |
43.11 |
43.11 - 43.11 |
0.0478 times |
Tue 02 December 2025 |
43.11 (-16.36%) |
43.04 |
43.04 - 44.00 |
0.5717 times |
Wed 15 October 2025 |
51.54 (3.79%) |
47.00 |
47.00 - 54.62 |
2.4424 times |
Tue 14 October 2025 |
49.66 (-6.74%) |
53.05 |
49.00 - 54.96 |
0.7408 times |
Mon 13 October 2025 |
53.25 (-8.19%) |
57.99 |
52.22 - 59.00 |
2.0936 times |
Fri 10 October 2025 |
58.00 (4.39%) |
54.50 |
52.10 - 59.60 |
6.6477 times |

Weekly price and charts AbmInternational Strong weekly Stock price targets for AbmInternational ABMINTLLTD are 40.25 and 45.53 | Weekly Target 1 | 39.28 | | Weekly Target 2 | 41.22 | | Weekly Target 3 | 44.556666666667 | | Weekly Target 4 | 46.5 | | Weekly Target 5 | 49.84 |
Weekly price and volumes for Abm International
| Date |
Closing |
Open |
Range |
Volume |
Wed 10 December 2025 |
43.17 (-4.19%) |
46.99 |
42.61 - 47.89 |
0.1488 times |
Fri 05 December 2025 |
45.06 (-12.57%) |
43.04 |
39.60 - 46.80 |
0.4333 times |
Wed 15 October 2025 |
51.54 (-11.14%) |
57.99 |
47.00 - 59.00 |
0.6503 times |
Fri 10 October 2025 |
58.00 (-22.14%) |
44.45 |
43.00 - 59.60 |
2.4029 times |
Tue 01 July 2025 |
74.49 (10.22%) |
70.95 |
70.95 - 74.49 |
0.2518 times |
Fri 27 June 2025 |
67.58 (44.09%) |
45.10 |
45.10 - 67.58 |
4.8373 times |
Fri 20 June 2025 |
46.90 (-2.49%) |
48.15 |
46.51 - 50.26 |
0.2403 times |
Fri 13 June 2025 |
48.10 (-1.84%) |
51.40 |
47.60 - 51.40 |
0.4354 times |
Fri 06 June 2025 |
49.00 (1.81%) |
49.09 |
44.33 - 49.90 |
0.2066 times |
Fri 30 May 2025 |
48.13 (-2%) |
49.10 |
47.11 - 52.00 |
0.3933 times |
Fri 23 May 2025 |
49.11 (-3.14%) |
50.70 |
48.99 - 51.86 |
0.2833 times |
Monthly price and charts AbmInternational Strong monthly Stock price targets for AbmInternational ABMINTLLTD are 41.39 and 49.68 | Monthly Target 1 | 35.26 | | Monthly Target 2 | 39.22 | | Monthly Target 3 | 43.553333333333 | | Monthly Target 4 | 47.51 | | Monthly Target 5 | 51.84 |
Monthly price and volumes Abm International
| Date |
Closing |
Open |
Range |
Volume |
Wed 10 December 2025 |
43.17 (-16.24%) |
43.04 |
39.60 - 47.89 |
0.1745 times |
Wed 15 October 2025 |
51.54 (-30.81%) |
44.45 |
43.00 - 59.60 |
0.9154 times |
Tue 01 July 2025 |
74.49 (4.99%) |
74.49 |
74.49 - 74.49 |
0.0267 times |
Mon 30 June 2025 |
70.95 (47.41%) |
49.09 |
44.33 - 70.95 |
1.7637 times |
Fri 30 May 2025 |
48.13 (-6.85%) |
52.97 |
46.00 - 53.26 |
0.7711 times |
Wed 30 April 2025 |
51.67 (23.38%) |
43.97 |
42.93 - 55.77 |
0.6181 times |
Fri 28 March 2025 |
41.88 (-11.06%) |
46.09 |
40.93 - 54.00 |
0.4125 times |
Fri 28 February 2025 |
47.09 (-55.31%) |
64.05 |
46.55 - 64.05 |
0.2403 times |
Wed 30 October 2024 |
105.36 (48.04%) |
53.00 |
52.00 - 105.36 |
1.9133 times |
Tue 18 June 2024 |
71.17 (15.91%) |
62.00 |
60.25 - 80.75 |
3.1642 times |
Fri 31 May 2024 |
61.40 (-5.9%) |
67.70 |
61.05 - 71.95 |
1.8661 times |
DMA SMA EMA moving averages of Abm International ABMINTLLTD
DMA (daily moving average) of Abm International ABMINTLLTD
| DMA period | DMA value | | 5 day DMA | 44.39 | | 12 day DMA | 48.01 | | 20 day DMA | 52.7 | | 35 day DMA | 51.13 | | 50 day DMA | 50.63 | | 100 day DMA | 49.61 | | 150 day DMA | 55.47 | | 200 day DMA | 56.5 | EMA (exponential moving average) of Abm International ABMINTLLTD
| EMA period | EMA current | EMA prev | EMA prev2 | | 5 day EMA | 44.68 | 45.44 | 45.69 | | 12 day EMA | 47.21 | 47.95 | 48.5 | | 20 day EMA | 48.95 | 49.56 | 50.05 | | 35 day EMA | 50.01 | 50.41 | 50.73 | | 50 day EMA | 49.86 | 50.13 | 50.34 |
SMA (simple moving average) of Abm International ABMINTLLTD
| SMA period | SMA current | SMA prev | SMA prev2 | | 5 day SMA | 44.39 | 44.38 | 44.01 | | 12 day SMA | 48.01 | 48.68 | 48.81 | | 20 day SMA | 52.7 | 53.2 | 53.37 | | 35 day SMA | 51.13 | 51.29 | 51.38 | | 50 day SMA | 50.63 | 50.71 | 50.79 | | 100 day SMA | 49.61 | 49.69 | 49.75 | | 150 day SMA | 55.47 | 55.62 | 55.78 | | 200 day SMA | 56.5 | 56.58 | 56.66 |
|
|
