AB ABCOTS_SM full analysis,charts,indicators,moving averages,SMA,DMA,EMA,ADX,MACD,RSIA B ABCOTS_SM WideScreen charts, DMA,SMA,EMA technical analysis, forecast prediction, by indicators ADX,MACD,RSI,CCI NSE stock exchange
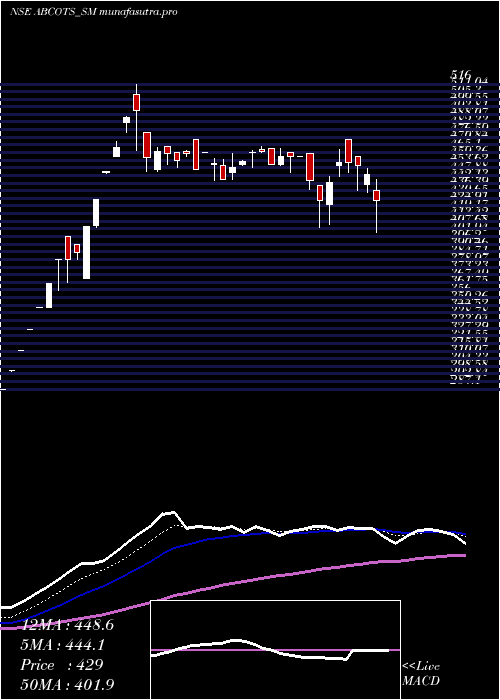
Daily price and charts and targets AB Strong Daily Stock price targets for AB ABCOTS_SM are 402.75 and 412.7 | Daily Target 1 | 394.55 | | Daily Target 2 | 401 | | Daily Target 3 | 404.5 | | Daily Target 4 | 410.95 | | Daily Target 5 | 414.45 |
Daily price and volume A B
| Date |
Closing |
Open |
Range |
Volume |
Wed 03 September 2025 |
407.45 (-0.21%) |
405.00 |
398.05 - 408.00 |
0.5587 times |
Tue 02 September 2025 |
408.30 (4.11%) |
410.00 |
390.00 - 410.00 |
1.676 times |
Mon 01 September 2025 |
392.20 (-5.57%) |
402.15 |
370.10 - 402.15 |
1.9832 times |
Fri 29 August 2025 |
415.35 (-0.97%) |
417.75 |
401.70 - 420.00 |
1.9274 times |
Thu 28 August 2025 |
419.40 (1.85%) |
405.00 |
405.00 - 419.40 |
0.0559 times |
Tue 26 August 2025 |
411.80 (-0.15%) |
405.00 |
401.10 - 415.00 |
0.4469 times |
Mon 25 August 2025 |
412.40 (-0.1%) |
430.00 |
405.00 - 430.00 |
0.8939 times |
Fri 22 August 2025 |
412.80 (0.34%) |
407.30 |
407.30 - 412.90 |
0.3352 times |
Thu 21 August 2025 |
411.40 (-0.78%) |
404.00 |
400.10 - 412.95 |
0.7263 times |
Wed 20 August 2025 |
414.65 (1.2%) |
425.00 |
411.00 - 425.00 |
1.3966 times |
Tue 19 August 2025 |
409.75 (-1.7%) |
403.00 |
402.15 - 409.80 |
0.1397 times |
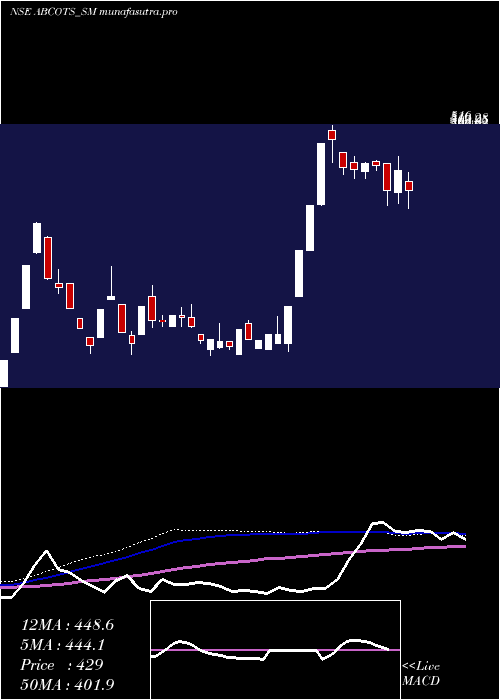
Weekly price and charts AB Strong weekly Stock price targets for AB ABCOTS_SM are 388.78 and 428.68 | Weekly Target 1 | 355.95 | | Weekly Target 2 | 381.7 | | Weekly Target 3 | 395.85 | | Weekly Target 4 | 421.6 | | Weekly Target 5 | 435.75 |
Weekly price and volumes for A B
| Date |
Closing |
Open |
Range |
Volume |
Wed 03 September 2025 |
407.45 (-1.9%) |
402.15 |
370.10 - 410.00 |
1.0141 times |
Fri 29 August 2025 |
415.35 (0.62%) |
430.00 |
401.10 - 430.00 |
0.7992 times |
Fri 22 August 2025 |
412.80 (-1.24%) |
416.85 |
400.10 - 425.00 |
0.6313 times |
Thu 14 August 2025 |
418.00 (0.04%) |
416.85 |
405.00 - 430.00 |
0.5574 times |
Fri 08 August 2025 |
417.85 (1.88%) |
417.50 |
390.10 - 448.00 |
0.2552 times |
Fri 01 August 2025 |
410.15 (0.06%) |
403.55 |
395.05 - 437.50 |
2.1692 times |
Fri 25 July 2025 |
409.90 (-5.75%) |
455.00 |
399.75 - 455.00 |
1.0678 times |
Fri 18 July 2025 |
434.90 (0.68%) |
432.00 |
423.00 - 459.00 |
0.8664 times |
Fri 11 July 2025 |
431.95 (-1.53%) |
424.00 |
418.00 - 436.50 |
1.3633 times |
Fri 04 July 2025 |
438.65 (3.71%) |
422.95 |
415.15 - 438.80 |
1.276 times |
Fri 27 June 2025 |
422.95 (-5.28%) |
446.55 |
410.05 - 454.70 |
0.9537 times |
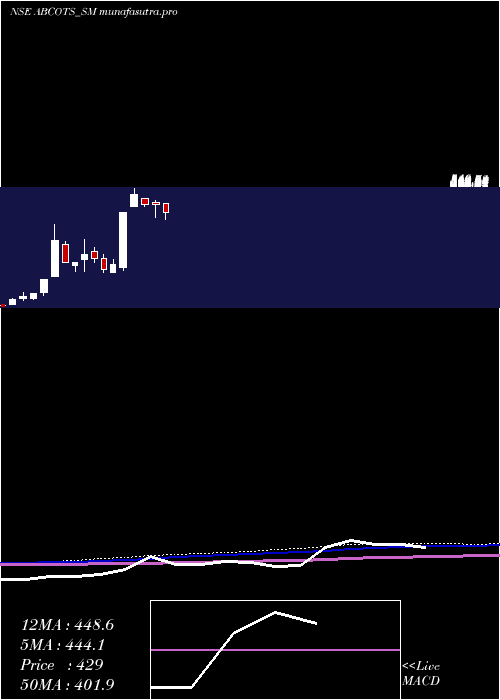
Monthly price and charts AB Strong monthly Stock price targets for AB ABCOTS_SM are 388.78 and 428.68 | Monthly Target 1 | 355.95 | | Monthly Target 2 | 381.7 | | Monthly Target 3 | 395.85 | | Monthly Target 4 | 421.6 | | Monthly Target 5 | 435.75 |
Monthly price and volumes A B
| Date |
Closing |
Open |
Range |
Volume |
Wed 03 September 2025 |
407.45 (-1.9%) |
402.15 |
370.10 - 410.00 |
0.3033 times |
Fri 29 August 2025 |
415.35 (0.27%) |
437.00 |
390.10 - 448.00 |
0.7692 times |
Thu 31 July 2025 |
414.25 (-2.1%) |
415.15 |
399.75 - 459.00 |
1.8598 times |
Mon 30 June 2025 |
423.15 (-3.18%) |
449.10 |
410.05 - 471.95 |
1.7353 times |
Fri 30 May 2025 |
437.05 (-4.55%) |
461.95 |
405.05 - 469.00 |
0.9761 times |
Wed 30 April 2025 |
457.90 (-0.27%) |
466.00 |
408.85 - 475.00 |
1.7011 times |
Fri 28 March 2025 |
459.15 (-7.52%) |
480.00 |
451.00 - 480.00 |
0.7873 times |
Mon 07 October 2024 |
496.50 (15.61%) |
449.80 |
449.50 - 516.00 |
0.7994 times |
Mon 30 September 2024 |
429.45 (81.2%) |
225.15 |
213.75 - 429.95 |
0.8757 times |
Fri 30 August 2024 |
237.00 (7.73%) |
210.00 |
210.00 - 254.70 |
0.1928 times |
Tue 30 July 2024 |
220.00 (-15.06%) |
259.00 |
209.10 - 276.00 |
0.1968 times |
DMA SMA EMA moving averages of A B ABCOTS_SM
DMA (daily moving average) of A B ABCOTS_SM
| DMA period | DMA value | | 5 day DMA | 408.54 | | 12 day DMA | 411.03 | | 20 day DMA | 412.84 | | 35 day DMA | 416.3 | | 50 day DMA | 419.96 | | 100 day DMA | 433.89 | | 150 day DMA | 393.43 | | 200 day DMA | 358.82 | EMA (exponential moving average) of A B ABCOTS_SM
| EMA period | EMA current | EMA prev | EMA prev2 | | 5 day EMA | 407.61 | 407.69 | 407.39 | | 12 day EMA | 410.28 | 410.8 | 411.26 | | 20 day EMA | 412.5 | 413.03 | 413.53 | | 35 day EMA | 416.8 | 417.35 | 417.88 | | 50 day EMA | 420.7 | 421.24 | 421.77 |
SMA (simple moving average) of A B ABCOTS_SM
| SMA period | SMA current | SMA prev | SMA prev2 | | 5 day SMA | 408.54 | 409.41 | 410.23 | | 12 day SMA | 411.03 | 411.91 | 412.13 | | 20 day SMA | 412.84 | 413.62 | 413.71 | | 35 day SMA | 416.3 | 416.95 | 417.62 | | 50 day SMA | 419.96 | 420.38 | 421.14 | | 100 day SMA | 433.89 | 434.46 | 434.91 | | 150 day SMA | 393.43 | 392.25 | 390.99 | | 200 day SMA | 358.82 | 358 | 357.13 |
|
|
