AB ABCOTS full analysis,charts,indicators,moving averages,SMA,DMA,EMA,ADX,MACD,RSIA B ABCOTS WideScreen charts, DMA,SMA,EMA technical analysis, forecast prediction, by indicators ADX,MACD,RSI,CCI NSE stock exchange
Daily price and charts and targets AB Strong Daily Stock price targets for AB ABCOTS are 409.85 and 427.15 | Daily Target 1 | 405.7 | | Daily Target 2 | 414 | | Daily Target 3 | 423 | | Daily Target 4 | 431.3 | | Daily Target 5 | 440.3 |
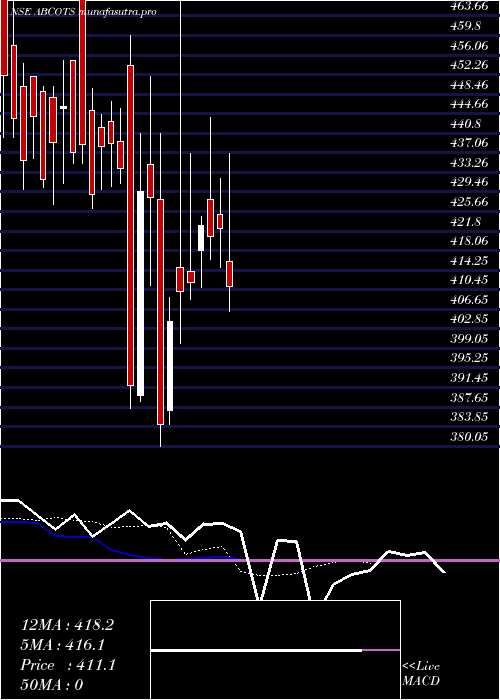
Daily price and volume A B
| Date |
Closing |
Open |
Range |
Volume |
Tue 28 October 2025 |
422.30 (0.34%) |
425.05 |
414.70 - 432.00 |
0.5028 times |
Mon 27 October 2025 |
420.85 (-0.51%) |
428.00 |
416.30 - 444.00 |
0.5459 times |
Fri 24 October 2025 |
423.00 (2.68%) |
418.00 |
411.00 - 424.60 |
0.4012 times |
Thu 23 October 2025 |
411.95 (0.46%) |
414.00 |
408.50 - 437.00 |
1.7168 times |
Tue 21 October 2025 |
410.05 (1.43%) |
414.80 |
400.00 - 467.95 |
2.5128 times |
Mon 20 October 2025 |
404.25 (5.2%) |
387.00 |
384.25 - 408.95 |
0.4917 times |
Fri 17 October 2025 |
384.25 (-10.31%) |
427.95 |
380.05 - 440.90 |
1.0783 times |
Thu 16 October 2025 |
428.40 (-0.24%) |
434.80 |
411.30 - 451.90 |
0.6685 times |
Wed 15 October 2025 |
429.45 (9.61%) |
389.95 |
388.80 - 440.75 |
1.1345 times |
Tue 14 October 2025 |
391.80 (-9.74%) |
454.05 |
387.40 - 459.80 |
0.9475 times |
Mon 13 October 2025 |
434.10 (-1.07%) |
439.30 |
431.00 - 445.60 |
0.4944 times |
Weekly price and charts AB Strong weekly Stock price targets for AB ABCOTS are 403.85 and 433.15 | Weekly Target 1 | 397.7 | | Weekly Target 2 | 410 | | Weekly Target 3 | 427 | | Weekly Target 4 | 439.3 | | Weekly Target 5 | 456.3 |
Weekly price and volumes for A B
| Date |
Closing |
Open |
Range |
Volume |
Tue 28 October 2025 |
422.30 (-0.17%) |
428.00 |
414.70 - 444.00 |
0.3096 times |
Fri 24 October 2025 |
423.00 (10.08%) |
387.00 |
384.25 - 467.95 |
1.5123 times |
Fri 17 October 2025 |
384.25 (-12.43%) |
439.30 |
380.05 - 459.80 |
1.2763 times |
Fri 10 October 2025 |
438.80 (-1.63%) |
455.00 |
426.30 - 474.90 |
0.6968 times |
Fri 03 October 2025 |
446.05 (0%) |
451.85 |
427.00 - 454.95 |
1.2049 times |
Tue 28 October 2025 |
(0%) |
|
- |
0 times |

Monthly price and charts AB Strong monthly Stock price targets for AB ABCOTS are 353.75 and 448.6 | Monthly Target 1 | 330.9 | | Monthly Target 2 | 376.6 | | Monthly Target 3 | 425.75 | | Monthly Target 4 | 471.45 | | Monthly Target 5 | 520.6 |
Monthly price and volumes A B
| Date |
Closing |
Open |
Range |
Volume |
Tue 28 October 2025 |
422.30 (-2.2%) |
447.80 |
380.05 - 474.90 |
1.408 times |
Tue 30 September 2025 |
431.80 (0%) |
474.95 |
430.00 - 504.00 |
0.592 times |
Tue 28 October 2025 |
(0%) |
|
- |
0 times |

DMA SMA EMA moving averages of A B ABCOTS
DMA (daily moving average) of A B ABCOTS
| DMA period | DMA value | | 5 day DMA | 417.63 | | 12 day DMA | 416.6 | | 20 day DMA | 425.17 | | 35 day DMA | | | 50 day DMA | | | 100 day DMA | | | 150 day DMA | | | 200 day DMA | | EMA (exponential moving average) of A B ABCOTS
| EMA period | EMA current | EMA prev | EMA prev2 | | 5 day EMA | 418.54 | 416.66 | 414.56 | | 12 day EMA | 419.52 | 419.02 | 418.69 | | 20 day EMA | 426.78 | 427.25 | 427.92 | | 35 day EMA | 0 | 0 | 0 | | 50 day EMA | 0 | 0 | 0 |
SMA (simple moving average) of A B ABCOTS
| SMA period | SMA current | SMA prev | SMA prev2 | | 5 day SMA | 417.63 | 414.02 | 406.7 | | 12 day SMA | 416.6 | 417.93 | 418.61 | | 20 day SMA | 425.17 | 425.84 | | 35 day SMA | | 50 day SMA | | 100 day SMA | | 150 day SMA | | 200 day SMA |
|
|
