AbbottIndia ABBOTINDIA full analysis,charts,indicators,moving averages,SMA,DMA,EMA,ADX,MACD,RSIAbbott India ABBOTINDIA WideScreen charts, DMA,SMA,EMA technical analysis, forecast prediction, by indicators ADX,MACD,RSI,CCI NSE stock exchange
operates under Pharmaceuticals sector
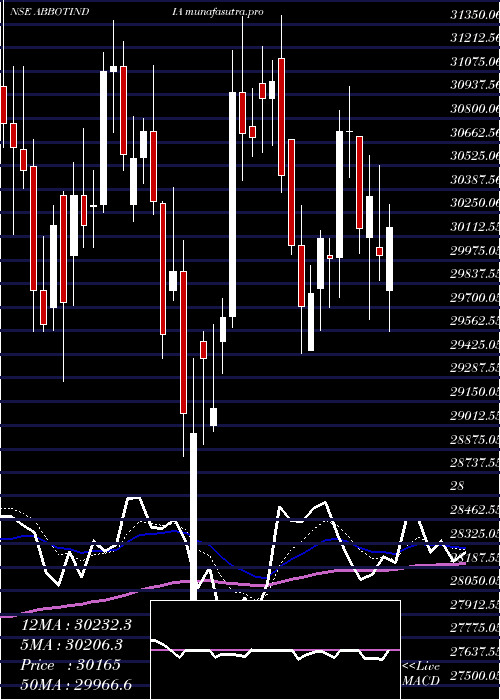
Daily price and charts and targets AbbottIndia Strong Daily Stock price targets for AbbottIndia ABBOTINDIA are 29510 and 29805 | Daily Target 1 | 29445 | | Daily Target 2 | 29575 | | Daily Target 3 | 29740 | | Daily Target 4 | 29870 | | Daily Target 5 | 30035 |
Daily price and volume Abbott India
| Date |
Closing |
Open |
Range |
Volume |
Wed 29 October 2025 |
29705.00 (-0.22%) |
29790.00 |
29610.00 - 29905.00 |
0.852 times |
Tue 28 October 2025 |
29770.00 (0%) |
29775.00 |
29700.00 - 30000.00 |
0.9019 times |
Mon 27 October 2025 |
29770.00 (-0.53%) |
29935.00 |
29655.00 - 29935.00 |
1.7204 times |
Fri 24 October 2025 |
29930.00 (-0.61%) |
30230.00 |
29805.00 - 30230.00 |
0.7154 times |
Thu 23 October 2025 |
30115.00 (-0.46%) |
30300.00 |
29870.00 - 30320.00 |
1.1122 times |
Tue 21 October 2025 |
30255.00 (1.09%) |
29990.00 |
29875.00 - 30330.00 |
0.2887 times |
Mon 20 October 2025 |
29930.00 (0.42%) |
29970.00 |
29600.00 - 30250.00 |
0.9992 times |
Fri 17 October 2025 |
29805.00 (-0.1%) |
29995.00 |
29665.00 - 29995.00 |
0.6121 times |
Thu 16 October 2025 |
29835.00 (0.02%) |
29850.00 |
29670.00 - 29950.00 |
1.6855 times |
Wed 15 October 2025 |
29830.00 (-0.88%) |
30095.00 |
29700.00 - 30195.00 |
1.1126 times |
Tue 14 October 2025 |
30095.00 (0.33%) |
30145.00 |
29805.00 - 30250.00 |
1.2566 times |
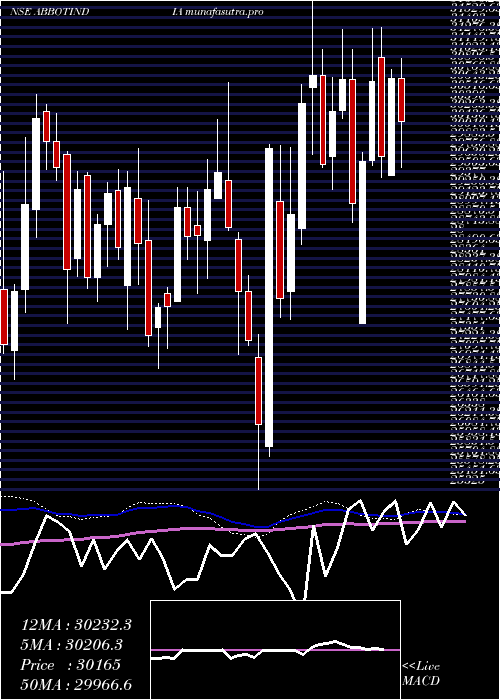
Weekly price and charts AbbottIndia Strong weekly Stock price targets for AbbottIndia ABBOTINDIA are 29462.5 and 29852.5 | Weekly Target 1 | 29381.67 | | Weekly Target 2 | 29543.33 | | Weekly Target 3 | 29771.666666667 | | Weekly Target 4 | 29933.33 | | Weekly Target 5 | 30161.67 |
Weekly price and volumes for Abbott India
| Date |
Closing |
Open |
Range |
Volume |
Wed 29 October 2025 |
29705.00 (-0.75%) |
29935.00 |
29610.00 - 30000.00 |
0.4643 times |
Fri 24 October 2025 |
29930.00 (0.42%) |
29970.00 |
29600.00 - 30330.00 |
0.4164 times |
Fri 17 October 2025 |
29805.00 (-1.08%) |
30130.00 |
29665.00 - 30250.00 |
0.7594 times |
Fri 10 October 2025 |
30130.00 (0.55%) |
30125.00 |
29575.00 - 30560.00 |
0.7004 times |
Fri 03 October 2025 |
29965.00 (0.76%) |
29740.00 |
29060.00 - 30400.00 |
0.9897 times |
Fri 26 September 2025 |
29740.00 (-2.06%) |
30410.00 |
29150.00 - 30670.00 |
1.5542 times |
Fri 19 September 2025 |
30365.00 (-1.99%) |
30900.00 |
30130.00 - 31400.00 |
1.4263 times |
Fri 12 September 2025 |
30980.00 (-0.55%) |
31415.00 |
30540.00 - 31645.00 |
1.6524 times |
Fri 05 September 2025 |
31150.00 (-1.05%) |
31650.00 |
31030.00 - 32775.00 |
1.1854 times |
Fri 29 August 2025 |
31480.00 (-1.24%) |
32145.00 |
31175.00 - 32145.00 |
0.8516 times |
Fri 22 August 2025 |
31875.00 (-4.18%) |
33495.00 |
31750.00 - 33495.00 |
0.9224 times |
Monthly price and charts AbbottIndia Strong monthly Stock price targets for AbbottIndia ABBOTINDIA are 29552.5 and 30712.5 | Monthly Target 1 | 28728.33 | | Monthly Target 2 | 29216.67 | | Monthly Target 3 | 29888.333333333 | | Monthly Target 4 | 30376.67 | | Monthly Target 5 | 31048.33 |
Monthly price and volumes Abbott India
| Date |
Closing |
Open |
Range |
Volume |
Wed 29 October 2025 |
29705.00 (1.42%) |
29500.00 |
29400.00 - 30560.00 |
0.4588 times |
Tue 30 September 2025 |
29290.00 (-6.96%) |
31650.00 |
29060.00 - 32775.00 |
1.0136 times |
Fri 29 August 2025 |
31480.00 (-8.5%) |
34550.00 |
31175.00 - 34815.00 |
0.6374 times |
Thu 31 July 2025 |
34405.00 (-3.55%) |
35675.00 |
32565.00 - 35955.00 |
0.7652 times |
Mon 30 June 2025 |
35670.00 (17.12%) |
30455.00 |
30110.00 - 37000.00 |
1.2578 times |
Fri 30 May 2025 |
30455.00 (1.57%) |
29990.00 |
29555.00 - 31590.00 |
0.9138 times |
Wed 30 April 2025 |
29985.00 (-2.39%) |
30720.55 |
27500.05 - 31400.00 |
0.6415 times |
Fri 28 March 2025 |
30720.55 (1.07%) |
30610.20 |
29264.10 - 31898.95 |
1.0735 times |
Fri 28 February 2025 |
30395.65 (16.13%) |
25892.10 |
25760.05 - 30650.00 |
2.1386 times |
Fri 31 January 2025 |
26173.30 (-12%) |
29830.20 |
25325.00 - 30668.00 |
1.0998 times |
Tue 31 December 2024 |
29741.00 (7.28%) |
27800.00 |
27800.00 - 30089.85 |
1.0133 times |
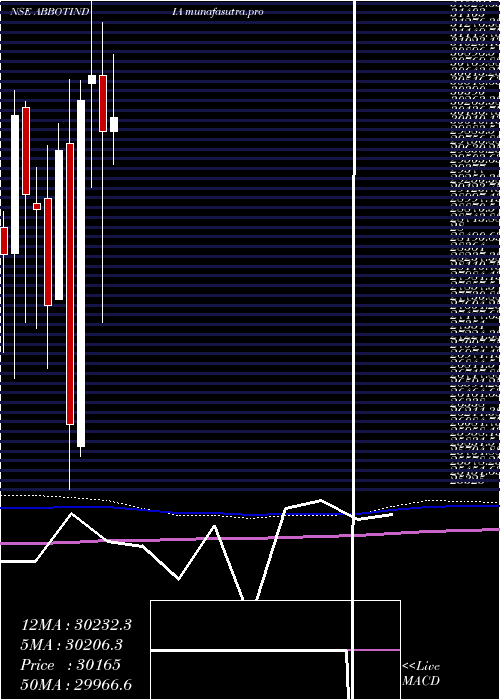
DMA SMA EMA moving averages of Abbott India ABBOTINDIA
DMA (daily moving average) of Abbott India ABBOTINDIA
| DMA period | DMA value | | 5 day DMA | 29858 | | 12 day DMA | 29919.58 | | 20 day DMA | 29888.5 | | 35 day DMA | 30168.29 | | 50 day DMA | 30730 | | 100 day DMA | 32046.35 | | 150 day DMA | 31495.41 | | 200 day DMA | 30831.31 | EMA (exponential moving average) of Abbott India ABBOTINDIA
| EMA period | EMA current | EMA prev | EMA prev2 | | 5 day EMA | 29818.84 | 29875.75 | 29928.62 | | 12 day EMA | 29897.7 | 29932.72 | 29962.3 | | 20 day EMA | 30011.73 | 30044 | 30072.83 | | 35 day EMA | 30412.81 | 30454.48 | 30494.78 | | 50 day EMA | 30821.11 | 30866.65 | 30911.39 |
SMA (simple moving average) of Abbott India ABBOTINDIA
| SMA period | SMA current | SMA prev | SMA prev2 | | 5 day SMA | 29858 | 29968 | 30000 | | 12 day SMA | 29919.58 | 29955 | 29948.33 | | 20 day SMA | 29888.5 | 29886.5 | 29885 | | 35 day SMA | 30168.29 | 30204.29 | 30243.71 | | 50 day SMA | 30730 | 30801.2 | 30864.6 | | 100 day SMA | 32046.35 | 32066.25 | 32081.5 | | 150 day SMA | 31495.41 | 31498.57 | 31502.43 | | 200 day SMA | 30831.31 | 30832.58 | 30833.48 |
|
|
